EENS 3050

Natural Disasters

Tulane University

Prof. Stephen A. Nelson

Homework Assignment II. Seismological Exercises
Spring 2018


Answer the following questions. Typewritten answers should be turned in along with any maps required to answer the questions. Note that it is recommended that you use the PDF version of this file and print the figures on a high quality ink jet printer using the black and white only setting, to see the highest resolution images.  This will enable you to be much more precise in locating the earthquake in problem 1.  
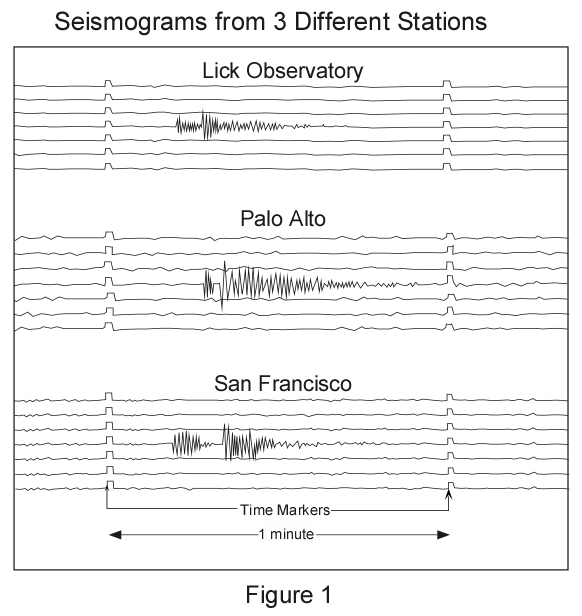
  1. Shown below in Figure 1 are three seismograms that show the records of a small earthquake somewhere in California. Time is marked on each seismogram by offsets in the records. Each offset corresponds to the passage of 1 minute. The records are read from left to right. Both P and S wave arrivals are recorded.


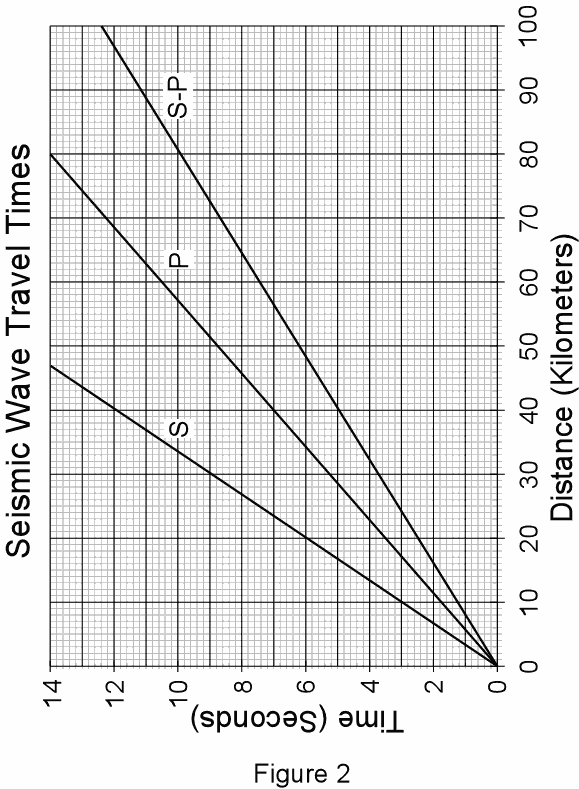
    Shown below in Figure 2 are travel time curves for P and S waves determined from local earthquakes in California. Also shown is a curve (line) labeled S-P, which is travel time of the S wave minus the travel time of the P wave.

    1. From Figure 1, first carefully determine the time interval between the arrival of the first S wave and the arrival of the first P wave at each seismographic station. It is important that you determine these S-P intervals as precisely as possible. (2 points)

    2. From Figure 2, determine the distance of each seismographic station from the earthquake, again, it is important that you be as precise as possible. (2 points)

    3. Then, using the map below in Figure 3, and a drawing compass, locate the epicenter of this earthquake. (Note that you need to turn in the map showing how you located the epicenter) (2 points)

    4. On which fault did the earthquake most likely occur? (1 point)


  1. On October 17, 1989, just prior to game 3 of the World Series between the San Francisco Giants and the Oakland Athletics, a magnitude 7.1 Earthquake struck northern California (This earthquake is known as the Loma Prieta Earthquake). The earthquake occurred in the mountains west of San Jose California on the San Andreas Fault. As a result of the earthquake, 41 people were killed when a double-decked section of the Nimitz Freeway in Oakland collapsed, crushing people in the cars on the lower deck. A geologic map showing the various rock types present in the Oakland area and the location of the collapsed portion of the freeway (shown as a short dashed line) is depicted below in Figure 4. Between the thick bars is the area where the freeway was double-decked.


    On the map, the areas marked as Holocene mud are areas that were formerly occupied by San Francisco Bay, but have been filled with loose sediment in the last 100 years, the mud contains lots of water in the pore spaces between the grains. The areas marked Quaternary Alluvium are areas underlain by unconsolidated sediment deposited by streams over the last 2 million years. The area marked Franciscan Formation is underlain by solid sedimentary, igneous, and metamorphic rocks with a thin cover of soil.

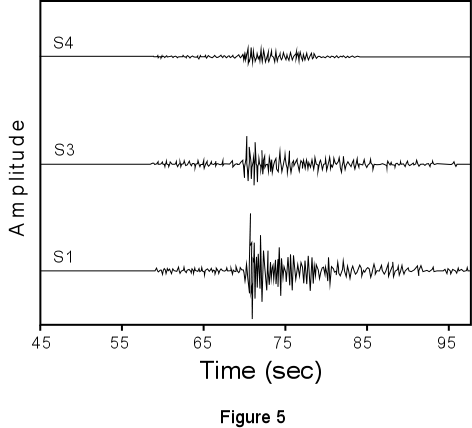
    Several days after the magnitude 7.1 earthquake, small aftershocks shook the area. All had epicenters near the main shock of October 17. Seismologists placed several portable seismometers at stations S1, S3, and S4 (as shown on the map) and recorded these aftershocks. Seismographic recordings for one of these aftershocks, a magnitude 4.1 earthquake, for each of the three stations are shown in Figure 5, below. Note that the epicenter of the aftershock was far enough away that all of the recording stations could be considered to be about the same distance from the earthquake.

  1. What observations can you make about the seismic response (degree of shaking) on the three types of materials underlying the area? (2 points)

  2. What conditions were likely responsible for the double-decked Nimitz Freeway freeway to collapse where it did? (3 points)

  3. Considering that New Orleans is built on water-saturated river muds, how do you think New Orleans would fare if there were a major earthquake nearby? (2 points)

  1. Three of the factors that are largely responsible for building damage during an earthquake are the degree of ground shaking, type of building construction, and liquefaction.  This exercise is designed to explore these relationships.  Imagine that you are given the opportunity to become the San Francisco Bay Area regional manager for Denyallclaims Insurance Company.  Because this company has such a high profit margin, they can afford to provide housing for their regional managers. Thus, one of the perks of the job is that they will give you title to a house in one of the prestigious suburbs of San Francisco, Mill Valley, located on the Marin Peninsula, north of San Francisco.  The company is offering you a choice between three different homes that they have somehow acquired.  Because you know that the San Francisco Bay Area is prone to earthquakes and you also know that you will have to pay the insurance premiums for both home owner's and earthquake insurance, you want to make the best choice of which home to take based on safety concerns and the ability of the house to withstand damage from possible future earthquakes.  Since Denyallclaims requires that you purchase insurance from them, you know that the premiums that you will pay will depend on the home's vulnerability and susceptibility to earthquake damage.  While surfing the web, you have found a web site produced by the Association of Bay Area Governments (ABAG) that provides information that will help you in making a decision - http://gis.abag.ca.gov/ 

    This site provides maps and information on such things as intensity of ground shaking, liquefaction, and the response of types of building construction to earthquakes, among lots of other useful information.

    The homes from which you get to choose are the following, all within the 94941 zip code:
  • 50 Oxford Av (Single Family Wood Frame 2 story house built before 1939)*  
             
  • 75 Avon Av (Unreinforced Masonry 2 story house). 
  • 170 Walnut Av. (Single Family Wood Frame 2 story house built after 1940). 

*Note that this exercise is hypothetical.  The actual existence of houses at these addresses is not known with certainty, nor are the construction characteristics at any of these houses known.  Any resemblance to actual houses or addresses is purely coincidental and is unintended. No Animals were harmed in the making of this exercise.


You should use the interactive liquefaction maps and shaking maps to first determine the susceptibility of each of these homes to liquefaction and shaking during a worst case scenario earthquake. Proceed as follows:

First, find Earthquakes - Liquefaction on the ABAG Map Portal Page and then click on the Liquefaction Susceptibility.. This will open the interactive liquefaction map.  The map is color coded for Liquefaction Susceptibility as shown in the Legend which is seen by clicking on the circled arrow in the box on the left-hand side of the page. You can find a particular address by moving the cursor over the icon that shows a globe with a magnifying glass in front of it and then clicking on Address in the drop-down menu. A box opens and you can type in the street address and zip code (94941) of one of the properties of interest. Then click on Locate.  The Map will zoom somewhat and you will need click on "Close" to close the address search box. On the map you can use the scroll wheel on your mouse to zoom in and zoom out, and you can hold down the left mouse button and move the mouse to move back and forth and up and down on the map. You will likely need to zoom in to the location you entered which is now marked on the map, to determine the liquefaction zone in which this property occurs.   Note that to see what the different color shades mean, you need to open the legend by clicking Legend at the top of the box on the left.  You should be able to locate each of the homes listed above by repeating the process.   For each of the three properties, determine the Liquefaction Susceptibility and record the information for later use.  

Next,go back to the main ABAG Map Portal Page and under Hazard Planning, Earthquakes - Shaking, click on Shaking Scenarios. then, in th ebox on the left chek check the box next to Northern San Andreas - All Segments.  Make sure no other boxes are checked.  This will open a map color coded for Shaking Severity due to an earthquake similar to the 1906 San Francisco Earthquake.   You can click on Legend to see what the color codes mean.   The Legend shows a color code for shaking potential. The colors represent Modified Mercalli Intensity (MMI) values, with the bottom (dark brown color representing a MMI value of 10, the lighter brown 9, red 8, dark orange 7, etc.  For each of the homes, determine the MMI values. 

Note that you do not need to print any of these maps for this part of the homework exercise. 

Answer the following questions -

  1. For each property, what is the Liquefaction Susceptibility and the Modified Mercalli Intensity (MMI) value for a large earthquake that could affect this area? (3 points)
     
  2. From your acquired knowledge of the relationships between shaking intensity, liquefaction, and the type of geologic material underlying an area, make an educated guess about the topography and materials that underlie each of the three properties (3 points).

Before you use the answers to the above questions to decide which property you will accept from Denyallclaims, you should consider the type of construction involved in each of the houses. 

To determine the effects of construction type during the shaking of the worst case scenario earthquake,  go to the following ABAG web page -http://quake.abag.ca.gov/wp-content/documents/2010-On-Shaky-Ground.pdf   Once this PDF file opens, go to Page 6 and read about SHAKING INTENSITY AND BUILDING DAMAGE. As you scroll down, you will see pictures of various types of construction damaged in other earthquakes., then look at Table 1 on page 8.  From the information you obtained above on MMI values knowledge of the construction type for each address, answer the following question:

  1. Which property would you accept from Denyallclaims based on all of the information available and your desire to have the safest and least earthquake susceptible house available, keeping in mind that Table I does not say anything about possible damage that may result from liquefaction (recall that liquefaction may cause damage to the foundation of the home)?  Discuss the reasoning used to obtain your answer. (3 points)
  1. On the internet, use the search engine of your choice (I recommend www.google.com) to find information about a major earthquake that occurred in the U.S. or Canada  in the year 1700. Then answer the following questions about the earthquake.

    1. Where did this earthquake occur and how big was it? (2 points)

    2. Considering that humans capable of recording information about the earthquake did not live in the area at the time of the earthquake, how do scientists know the exact date, time and size of this earthquake? (2 points)

    3. What is the plate tectonic setting of the area where the earthquake occurred? (1 point)

    4. What implications does this have for future earthquake potential in this region?  Specifically, what major cities could be affected by future earthquakes that could occur in this area? (2 points)

Return to EENS 3050 Homepage