TIDE-1220

New Orleans & Hurricanes

Tulane University

Prof. Stephen A. Nelson

The Risk to New Orleans - Present and Future
Fall 2013


What is the 100 - Year Flood/100 Year Storm?


The 100 yearflood is a statistical term for a flood or storm that has a 1% chance of occurring every year.

For river flooding, the statistical data is the peak annual discharge over a long period of time.

  • In order to determine the recurrence interval, the yearly discharge values are first ranked.  Each discharge is associated with a rank, m, with m = 1 given to the maximum discharge over the years of record, m = 2 given to the second highest discharge, m = 3 given to the third highest discharge, etc.

  • The smallest discharge will receive a rank equal to the number of years over which there is a record, n.  Thus, the discharge with the smallest value will have m = n.

  • The number of years of record, n, and the rank for each peak discharge are then used to calculate recurrence interval, R by the following equation, called the Weibull equation:

R = (n+1)/m

Graph of Peak Dischage vs. Recurrence Interval, then can be made to determine the discharge of the 100 year flood, 50 year flood, 10 year flood, etc. (see Figure 1).


Figure 1

The probability, Pe,  of a certain discharge can be calculated using the inverse of the Weibull equation:

Pe = m/(n+1)

The value, Pe, is called the annual exceedence probability. For example, a discharge equal to that of a 10-year flood would have an annual exceedence probability of 1/10 = 0.1 or 10%. 

This would say that in any given year, the probability that a flood with a discharge equal to or greater than that of a 10 year flood would be 0.1 or 10%. 

Similarly, the probability of a flood with discharge exceeding the 100 year flood in any given year would be 1/100 = 0.01, or 1%. 

Note that such probabilities are the same for every year.

Discharge (volume/sec) can be converted to Stage (elevation), then maps can be made of the area expected to be flooded by floods with various recurrence intervals (see figure. 2)

FloodMap.GIF (21479 bytes)

Figure 2

Despite the fact that the 100 year flood has only a 1% chance of occurring each year, the probabilities do accumulate over time.

The probability of a certain-size flood occurring during any period can be calculated using the following equation:

Pt = 1-(1-Pe)n


where Pt is the probability of occurrence over the entire time period, n,

          and Pe is the probability of occurrence in any year.


We can use this equation to calculate how the probabilities change over time. The result is depicted in the graph below for Pe = 0.01 (100 year flood) (see Figure 3)

Figure 3

2 important points emerge:

  1. The probability of a 100 year flood occurring in 100 years is NOT 100%! (See figure 4)

  2. The probability of a 100 year flood occurring in 30 years (the lifetime of the average home mortgage) is 26.0%!(See Figure 4)


Figure 4

To figure out the volume of water expected from hurricanes is more complicated.

The complications include:

  1. Hurricanes hitting a given area of coastline are infrequent, thus there is not a lot of data on which to base a statistical analysis.

  2. Hurricanes can take different paths (unlike streams).

  3. The amount of flooding depends on many factors, including, the amount of rainfall and the height of the storm surge and waves.

The amount of rainfall and the height of the storm surge and waves, also depends on many factors, including:


  1. The path of the storm

  2. The maximum hurricane wind velocity

  3. The storm center velocity

  4. The size of the storm

  5. The shape of the sea-floor as the storm approaches the coast.

  6. The shape of the coastline

For an area like New Orleans which is surrounded by levees and is composed of many sub-basins that need to be pumped out, the level of flooding is further complicated by such factors as

  1. The reliability of the levees and floodwalls

  2. The height of the levees and floodwalls

  3. The depth of each of the sub-basins

  4. The reliability and capacity of the pumps


Risk to New Orleans from Hurricanes

The Interagency Performance Evaluation Task Force (IPET) formed after Hurricane Katrina, undertook a risk analysis study that can be found in several different forms on the internet.

The full Risk analysis can be found at:

http://biotech.law.lsu.edu/katrina/ipet/ipet.html

As Volume VIII of the IPET Final Report.

A general description of the results of this study can also be found at this site (direct link below).

http://biotech.law.lsu.edu/katrina/ipet/SimpleRisk%20FINAL%2023jun09%20mh.pdf

Flood risk maps can be found at all of the above, and at:

http://nolarisk.usace.army.mil/#map


Summary of Findings


Pre-Katrina

The New Orleans area was highly vulnerable to flooding from moderate to large hurricanes and exposed to very high risk of loss of life and property.

Any event beyond the 50-year frequency of occurrence (2% chance of occurring each year) could produce significant flooding and losses.

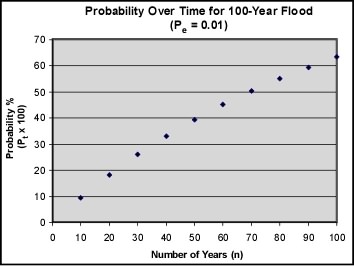
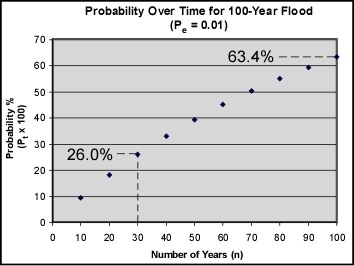
Large events such as the 100-year (1% chance each year) flood would cause extensive flooding and losses.

Extreme events like the 500-year (0.2% chance each year) flood would totally devastate the entire region.


Current (2007)

Improvements and repairs made since Katrina reduced vulnerability to flooding for a number of areas, particularly those areas (largely portions of Orleans Metro and Jefferson East) that benefited by the placement of the temporary gates at the ends of the outfall canals.

Many areas remain highly vulnerable to flooding from larger storms (100-year).

The greatest vulnerability is in the areas surrounding the Inner Harbor Navigation Canal and on the West Bank where a number of sections had no protective structures.

Extreme events would still totally devastate the area.

With 100 Year Protection System in Place (2011)

Dramatic reduction in vulnerability to flooding for a majority of the region.

In this system status, a 100-year flood event is largely the result of heavy rainfall, not overtopping or breaching from hurricane surge.

This system would also significantly reduce vulnerability of flooding for extreme events up to the 500-year event; however, some areas could experience significant flooding and losses.

Given similar evacuation conditions as in Katrina, the 2011 system (with significant online pumping capability during the storm) could reduce potential loss of life by as much as 97% for the 100-year flood event.

The 100-year System also dramatically reduces potential for loss of life from a 500-year flood event.

Given the same property distribution and value that existed prior to Katrina, the 100-year system would reduce direct property damages by 75% for the 100-year flood event and up to 75% for the 500-year flood event.

This benefit is directly attributed to the reduction of the severity of the 100-year and 500-year floods.

Importance of Pumping

Pumping capability during storm events is a crucial component of flood risk mitigation.

For the 100-year flood event, pumping equivalent to approximately 50% of the ideal capacity of existing pumps can reduce potential loss of life by approximately half for the 2007 system and up to 80% for the 2011 system.

Direct property losses from the 100-year flood can be reduced by up to 25% for the 2007 system.

For the 100-year system, up to 75% For the 500-year flood event, pumping can reduce loss of life potential by up to 50% and property losses by about 40% when the 2011 system is in place.

100% Risk Reduction Will Never Be Achieved No Matter How Large the Levees or Floodwalls

A 100-year system such as that planned for 2011 in New Orleans, should be considered a baseline, not an end-state, for an urban area.

There is still considerable risk from extreme events.

Risk reduction must be coupled with additional measures, structural and non-structural, that address the principal sources of the remaining residual risk.

For example: more effective evacuation or emergency response to reduce exposure of people to flooding, or flood proofing, compartmentalization or landuse zoning to reduce property damages.


Vulnerability to flooding and risk are functions of three things:

  1. .The hazard (the hurricane and its storm surge and waves).

  2. The system (levees, floodwalls, gates, pumps, etc.).

  3. The consequences (people and property).

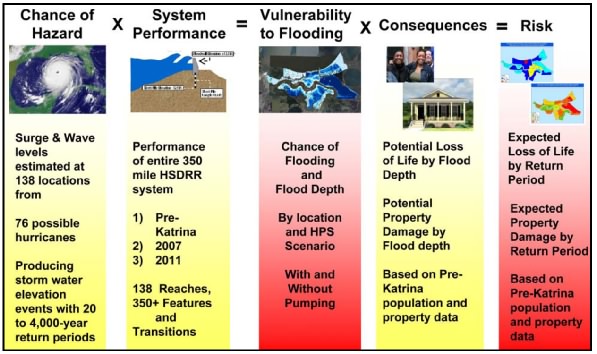
The IPET Risk Assessment Model is shown in Figure 5.


IPET Risk Assessment Model (see references above)

Figure 5

The Hazard


The hazard here is surge and wave conditions caused by hurricanes; it is not the hurricanes themselves.

To assess the hazard, the range, character, and frequency (chance) of hurricanes that may strike the southern Louisiana coast must be determined.

The surge levels for any hurricane will vary greatly depending on where one is located compared to the path of the hurricane.

The “100-year storm”, may not generate the 100-year surge level.

It is necessary to look at many storms and the surge levels they would create to gain a reasonable estimate of the surge level (at each location) with a one-in-one-hundred (100-year) chance of occurring.

The IPET Risk Analysis initially modeled 158 storms with various combinations of wind speed, storm speed, size, track, location of landfall, and storm shape.

These included some very large storms that would not necessarily be considered 100-year storms, but could produce 100-year levels of surge at some localities.

From this they were able to estimate the height of the surge along 138 reaches along the New Orleans hurricane protection system for events expected to produce the 100-year surge.

Exact modeling was done for 76 such storms.

The ADCIRC Storm Surge computer model was used to generate the data.

The System

Considered 138 levee reaches, 350 features (floodwalls, gates, barriers, transitions, etc.

The system performance was assessed by modeling how each structure and component of the system (levees, floodwalls, gates, etc.) would perform under the forces generated by surge and waves.

This allows estimation of the chance of overtopping and the chance of breaching for different surge and wave levels.

Included determination of the chance of failure based on the results of the IPET analysis of failures during Katrina.

The Vulnerability

Given the chance of overtopping and breaching for different surge and wave levels, the chance of flooding within each sub-basin is estimated.

Combining the potential for overtopping and breaching with the frequencies of the corresponding storm events leads to a vulnerability assessment of flooding from the whole range of hurricanes possible for the region.

The calculation also includes the chance of water entering through open gates and the amount of rainfall associated with hurricanes.

Combining the volume of water entering a basin with the geometry of the basin, allows estimation of the depth of flooding at any location within the basin.

Because water that enters a basin may or may not be pumped out, the total volume of water available for flooding depends on the ability of the pumps to remove the water.

Thus pumping capacity was also considered for 3 scenarios - 0%, 50%, and 100% pumping capacity.

These results were presented in a series of maps that show the potentially flooding depths for all of the basins in the region under various scenarios -

  • Pre- Katrina

  • Current (2007) after repairs of the system were undertaken

  • 2011 (after completion of the 100-year system)


These Flood Risk Maps can be found at:

https://ipet.wes.army.mil/NOHPP/_Post-Katrina/(IPET)%20Interagency%20Performance%20Evaluation%20TaskForce/
Reports/IPET%20Final%20Report/SimpleRisk%20FINAL%2023jun09%20mh.pdf


Consequences

The “Consequences” of flooding, measured by potential loss of life and property damage, are estimated by defining the distribution of people and structures within each subbasin,the elevations of all structures and the surrounding land, and the value of the
properties, and then by applying actuarial information and models to approximate losses.

The population numbers and property values used were all pre-Katrina.

Consequences were estimated for different depths of flooding to determine expected losses for the 1/100 (100-year), and 1/500 (500-year) year floods.

Risk

Risk is calculated by combining the chance of undesirable consequences occurring with the magnitude of those consequences.

This allows an estimate of risk by area, based on the character of the storm damage reduction infrastructure and other measures that may influence who and what is exposed to flooding.

Risk is calculated by multiplying the chance of flooding to a certain depth by the losses expected.

Losses can be expressed as potential loss of life or property.

See Risk Maps at

https://ipet.wes.army.mil/NOHPP/_Post-Katrina/(IPET)%20Interagency%20Performance%20Evaluation%20TaskForce/
Reports/IPET%20Final%20Report/SimpleRisk%20FINAL%2023jun09%20mh.pdf


Return to TIDE 1220 Homepage