| EENS 2110 |
Mineralogy |
|
Tulane University |
Prof. Stephen A. Nelson |
|
Interference Phenomena, Compensation, and Optic Sign |
|
|
|
| As you have probably noticed by now, viewing an anisotropic crystal
under crossed polars (analyzer inserted) the crystal is extinct when
either of the two privileged directions in the crystal are lined up
parallel to the polarizing direction of the microscope. This is
because when the privileged directions are parallel to the polarizer, the
crystal does not change the polarization direction and the light will thus
be vibrating perpendicular to the analyzer. When the privileged
directions are not parallel to the polarizer some light is transmitted by
the analyzer and this light shows a color, called the interference
color. In this lecture we will discover what causes this
interference color and how it can be used to determine some of the optical
properties of the crystal.
The Interference of Light Waves Polarized in the Same Plane As we discussed in the lecture on X-rays, when electromagnetic waves emerge from a substance, they can interfere with each other and either become enhanced, partially destroyed, or completely destroyed. The same is true for polarized light. In the upper diagram below, labeled A, two waves polarized in the vertical plane are emerging from the polarizer. These waves are in phase, and thus we only see one wave. The difference between points on the same wave is called the path difference, symbolized as Δ. If the path difference is an integral number of wavelengths, nλ, the waves are in phase. For points that are completely out of phase, for example between crests and troughs of the wave, Δ will be equal to 1/2λ , 3/2λ, 5/2λ, etc. or [(2n+1)/2]λ. For path differences where the waves are completely out of phase, complete destructive interference will occur and no wave will emerge from the polarizer. For path differences that are neither in phase or completely out of phase, the waves will be summed together to produce a resultant wave with crests and troughs at different positions than the original waves. |
|
|
| This is
shown in the part of the diagram labeled B, and the blow-up to the right.
Furthermore, the vector sum of the two waves will produce a resultant wave with a different amplitude than the two original waves.
If the waves are traveling on the same path, but are polarized at 90o to each other, again the resultant wave becomes the vector sum of the two waves. To see this we need to look at a three dimensional view. In this case, the waves have emerged from a crystal polarized in the directions of the privileged directions in the crystal, but they are otherwise in phase. The resultant wave, shown here in dark gray, is the vector sum of the two waves, and is thus polarized at a 45o angle to the original waves. |
|
|
Path Difference or Retardation Resulting from Passage Through a Crystal
To see this, examine the figure shown below. Polarized light vibrating E-W enters the crystal from below. Upon entering the crystal this light is broken into a slow ray, vibrating parallel to the larger refractive index direction, N, and a fast ray, vibrating parallel to the lower refractive index direction, n. While in the crystal, the slow wave's wavelength decreases and it passes through 1½ wavelengths, while the fast wave passes through 1 wavelength. At the instant the slow wave emerges from the crystal, the fast wave has traveled a distance Δ. This is the path difference or retardation. |
|
 |
CN = t/TN and Cn = t/Tn
, where t is the thickness of the crystal.
Δ = t(C/CN - C/Cn)
|
| Polarization of the Resultant Wave
As discussed above, when the waves emerge from the crystal they will be polarized at 90o to each other. But, they will then interfere with each other and the resultant wave will be polarized in a plane that is the vector sum of the two waves. Thus, the resultant wave will have a vibration direction that may or may not be the same as when it entered. First we will look at two extreme cases, both of which are illustrated in the diagram below.
|
|
|
Another way of looking at this is by examining the diagrams below.
|
|
Again, looking at Case A, with the privileged directions lined up 45o off extinction, on entering the crystal the light is broken into two polarized rays vibrating parallel to each of the privileged directions. Imagine that the vectors shown are pointing at the crests of these waves. |
 |
|
At the top of the crystal, the waves are still in phase (i.e. their path difference is nλ), and thus their wave crests are at the same positions as when they entered the crystal. These waves are then resolved into a single polarized waved that is vibrating parallel to the polarizer. Such a wave will be extinguished by the analyzer. |
|
Looking at case B, again polarized light entering from below is broken into two waves in the crystal both of which vibrate parallel to the privileged directions in the crystal. But this time, one wave lags behind the other by ½ λ, so that at the top of the crystal it is at a trough on the wave path. |
 |
|
|
| For path differences of anything other than nλ or odd multiples of ½λ, some of the light emerging from the crystal will have a component parallel to the polarizing direction of the analyzer, and will thus be transmitted. For monochromatic light, the color transmitted will be the same as the color of the monochromatic light used to illuminate the crystal. (Note, in reality path differences of 1/4λ, 3/4λ, 5/4λ, etc. produce circularly polarized light, and all other fractions of full λ produce elliptically polarized light. To make things simpler, we have ignored these complications, and will assume all light leaving the crystal becomes plane polarized. |  |
| Transmission by the Analyzer (Monochromatic Light)
First we will consider only the case of a single wavelength of light (monochromatic light) as being incident on the crystal from below. In this case, the % of light transmitted by the analyzer, L depends on:
L= 100{cos2 Φ - sin 2(τ - Φ) sin 2τ sin2 [(Δ/λ)180o]} For the case where the analyzer is polarized 90o to the polarizer (Φ = 90o), and the crystal is viewed 45o off extinction (τ = 45o), this reduces to: L = 100 sin2 [(Δ/λ)180o]
Below, we plot this function. Note that for crystals that produce a path difference of nλ, 0% of the light is transmitted by the analyzer, for those that produce a path difference of odd multiples of ½λ, 100% of the light is transmitted. Intermediate values of path difference produce intermediate results. |
|
|
| Because path difference, Δ, depends on the thickness of the crystal, a crystal that varies in thickness will show the following effects. |
| Imagine that the crystal is illuminated with light having a wavelength corresponding to yellow. Path differences that vary between 0 and slightly more than 1½λ will be produced by the crystal due to its variable thickness. The top figure shows contours of where light retarded by ½λ, 1λ, and 1½λ will emerge from the crystal. The lower left figure shows that light will be polarized in the N-S direction along the zones of ½λ and 1½λ retardation, and thus light emerging from these zones will pass through the analyzer, as well as light retarded by intermediate multiples of λ. Along the zone where light is retarded by 1λ it will be vibrating perpendicular to the analyzer and thus will show as a dark band. A dark band will also occur along the edges of the crystal where Δ = 0. |  |
| Interference Colors Produced by Polychromatic Light
Next, we consider the case that we will encounter in our studies, that is illumination with white light (polychromatic light). If a crystal illuminated by white light is viewed with the crossed polarizers off the extinction position, colors, known as interference colors will be seen. These colors result from unequal transmission by the analyzer of the various components of white light. What wavelengths are seen depends on the retardation or path difference produced in the crystal for each of the wavelengths. Let's look at a couple of examples.
Imagine a crystal that has a thickness and birefringence that produces a retardation of 550 nm, viewed 45o off extinction. If we look at the graph above, or solve the equation above, we can determine the % transmission by the analyzer of some of the components of white light to construct a curve of %Transmitted by the Analyzer versus Wavelength of Light. |
| Wavelength (nm) | Retardation | %Transmitted by Analyzer |
| 400 | 550/400 = 13/8λ | 85 |
| 440 | 550/440 = 11/4λ | 50 |
| 488.9 | 550/488.9 = 11/8λ | 15 |
| 550 | 550/550 = 1λ | 0 |
| 628.6 | 550/628.6 = 7/8λ | 15 |
| 733.3 | 550/733.3 = 3/4λ | 50 |
| This is plotted in the solid curve in the graph shown here. Note that violet and some blue, as well as some red wavelengths are transmitted, while less of the green yellow and orange wavelengths will not be transmitted by the analyzer. Thus the crystal will show an interference color that is reddish violet. We call this color first order, or 1o red. |  |
| If the crystal produces a retardation of 800 nm, the dashed curve would be obtained. This curve shows little transmission of the violet and red wavelengths, and partial to full transmission of the green, yellow, and orange wavelengths. Thus the crystal will have a greenish interference color. |
| The Interference Color Chart
If this is done for all possible retardations and all wavelengths of light, it produces what is called an interference color chart, shown below. This chart has thickness of the crystal plotted on the y-axis and path difference or retardation, Δ, plotted on the x-axis. The interference colors are divided into orders, every 550 nm of path difference, only 3 orders are shown. Note that first order colors (1o) range from black to reddish violet, Blue only appears in the 2nd and 3rd order colors, higher orders have mainly pink and green shades. |
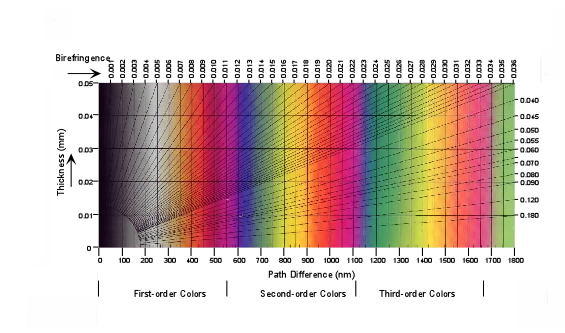 |
| Also plotted on the chart are diagonal lines representing various values
of birefringence (N - n) in this case. Thus, if the thickness of the
crystal is known, the birefringence for the privileged directions can be determined
from the interference color. This becomes important when we look at
thin sections of minerals, which are cut to a thickness of 0.03mm.
Thus for example a mineral in thin section that shows 1o red
interference colors has a birefringence of about 0.018. (Again, note this
may not be the absolute birefringence [|ε - ω|],
but only the birefringence for the fast and slow vibration directions
exposed by the orientation of the crystal [N - n]).
The interference colors at orders greater than order 6, become a blend of colors that is referred to as high order white. This high order white is different from 1o white for the following reason. A crystal with an interference color of 1o white produces a retardation of about 200 nm. This results in a transmission curve shown by the dashed line in the figure below. Note that this low order white results from all wavelengths being transmitted, but less of the orange and red colors and more of the violet, blue, and green colors, and thus appears more bluish to the eye |
| For crystals that produce a very high retardation, like 4000 nm, the
transmission curve is the solid curve in the diagram. Again, all
wavelengths are represented, but there are small gaps of wavelength where
wavelengths are not transmitted. This high order white appears more
creamy to the eye, and sometimes has kind of a light brownish white
hue.
With practice high order white is easily distinguished from low order white interference colors, as you will see in lab. |
 |
|
Accessory Plates and Compensation Accessory plates or compensators are crystals mounted in a frame that be inserted in the light path to produce further retardation of light after it has passed through the crystal. While several different accessory plates are commonly described, in this course we will use only one type. Still, you may encounter the other types in the future, so it is worthwhile to describe all of them here. |
|
 |
|
The wedge, like all compensators usually has its slow direction clearly marked, and is inserted into the microscope tube such that slow direction in the compensator is at a 45o angle to the polarizing direction. You will see a quartz wedge in the lab, but the microscopes we use do not have a slot that accommodates these older wedges. In today's economy, quartz wedges are too expensive to equip student microscopes with them. |
|
Use of 550 nm Plate (Compensator) The 550 nm or 1o red compensator can be used to determine
the fast and slow direction in a crystal. To do this, the crystal
must be aligned on the microscope stage with one of its privileged
directions oriented at 45o to the polarizing direction of the
microscope. We here consider both cases. |
|
 |
|
More importantly, if an area on the crystal that was 1o gray turns blue on insertion of the compensator, we know the direction in the crystal parallel to the slow direction in the compensator is the slow direction or higher R.I. direction. |
These principles are illustrated further in the diagrams shown below. In the upper diagram the crystal has its slow direction oriented in a NE - SW position. |
| With the analyzer inserted one can usually find an
area near the edge of the crystal that shows a 1o gray
interference color. When the 550 nm compensator is inserted this
gray area turns blue, addition has occurred, and we know that the slow
direction in the crystal is parallel to the slow direction in the
compensator.
In the lower diagram the crystal has been rotated so that its fast direction is now oriented in a NE - SW position. Again, an area near the thin edge of the crystal can be found that exhibits a 1o gray interference color. Insertion of the 550 nm compensator causes this area to become 1o yellow. This means subtraction has occurred and we now know that the fast direction in the crystal is parallel to the slow direction in the compensator. |
 |
| Determination of Optic Sign in Uniaxial Crystals In a practical sense this can be used to determine the optic sign in uniaxial minerals. To do this one would first have to determine which directions in a crystal correspond to the ε and ω directions.
In fact, there is yet an easier way to determine optic sign in uniaxial minerals that we will discuss after looking at another way to set up the microscope. |
|
All of the work you have done so far in lab has been with the microscope arranged in mode called orthoscope. In the orthoscope mode, light incident on and passing through the crystals on the microscope stage is perpendicular to the lower and upper surfaces of the crystals. In conoscope mode, a lens, called a condensing lens is inserted between the light source and the crystals, and is focused such the incident light is no longer perpendicular to the top and bottom of the crystal, but crosses within the crystal. In addition, another lens, called the Bertrand Lens is inserted between the objective and ocular lenses. |
|
|
To put the microscope in the conoscope mode you must do the following:
If we can find such a grain and we put the microscope in conoscope mode, we will see a centered uniaxial interference figure as discussed below.
|
| Centered Uniaxial Interference Figure
A centered uniaxial interference figure is shown in the diagram below. |
| It consists of dark bands that cross the field of view to form a black cross called isogyres. Depending on the thickness and birefringence of the mineral one may also see bands of color that form circles that are concentric with the center of the cross. These color bands are called isochromes. At the intersection of the bars of the cross is the melatope, where light that has traveled along the optic axis exits in the field of view. For a perfectly centered uniaxial interference figure, that is where the optic axis is exactly perpendicular to the microscope stage, the cross will not change position or orientation during a full 360o rotation of the stage. |  |
| Note that light that has vibrated parallel to an ω direction while in the crystal comes out in the interference figure in a pattern that is concentric to the melatope, and light that has vibrated parallel to an ε' direction in the crystal comes out vibrating in a radial pattern, as indicated in the figure above. The order of the interference colors seen in the isochromes increases away from the melatope. As the thickness and birefringence of the crystal increase, the number of isochromes seen in the interference figure increases. |
| Determination of Optic Sign
A uniaxial interference figure can be used to easily determine the optic sign of a mineral. In such a figure there will usually be an area close to the melatope that shows an interference color of 1o gray. Observe the effects of inserting the 1o red or 550 nm compensator on this gray area. |
|
 |
|
| Off-Centered Uniaxial Interference Figure
Finding a grain with the optic axis oriented exactly perpendicular to the stage will sometimes be very difficult. It would be much more common to find one wherein the optic axis is at a slight angle to being perpendicular to the microscope stage. Such a grain will exhibit the following properties:
|
| Such a grain would show an off centered optic axis figure as shown here. On rotation of the stage, the melatope would rotate in a circle around the perimeter of the field of view, and the bars of the isogyres would remain oriented E-W and N-S |  |
| Optic Sign from Off-Centered Interference Figure
Even with an off centered interference figure, optic sign can still be determined because one can keep track of the isogyres and still divide the figure into quadrants. |
| Again for an optically positive crystal, all NE and SW quadrants will turn blue and the NW and SE quadrants will turn yellow, both colors replacing the 1ogray color present before insertion of the compensator. |  |
| Similarly for an optically negative crystal, all NE and SW quadrants will turn yellow and all NW and SE quadrants will turn blue, both colors replacing the 1ogray color present before insertion of the compensator. |  |
| We next turn to some other optical properties that can be determined for uniaxial minerals that can provide some additional diagnostic tools in the identification of minerals. Some of these you will already have covered in lab, but it is still worthwhile to review them here. |
|
Extinction Angles
Extinction angle is defined as the angle between a crystal's privileged directions and any linear (in 2 dimensions) feature of the crystal. For crystals that show cleavage as the prominent linear feature, the cleavage traces may intersect or may be parallel to each other. In either case, the extinction angle can be determined by aligning the cross hairs of the microscope with one of the cleavage traces, inserting the analyzer, and measuring the smallest angle between the cleavage and the position where the crystal goes extinct. Because of the symmetry in tetragonal and hexagonal minerals, most cleavages will also show symmetry, and this will result in two possible cases, one for intersecting cleavages, called symmetrical extinction, and one for parallel cleavages, called parallel extinction. |
| For the case of symmetrical extinction, the crystal will be at the extinction position and show an extinction angle that is the same on either side of the cross-hair. The example shown here is for a tetragonal mineral with a cleavage like {110} or {011}. In the example, the crystal shown at its extinction position is not shown completely extinct, so that one may view the cleavages. Under the microscope the crystal would be completely black at the extinction position. |  |
| For the case of parallel extinction, the crystal will be at the extinction position when the cleavage is aligned parallel to the cross hairs. Note that in this case if the crystal is rotated 90o from this extinction position, that it will again be extinct. But remember that all anisotropic crystals have two extinction positions that are 90o apart, and that the extinction angle is defined as the smallest angle (in this case 0o). Again, in these diagrams, the crystal is not shown to be completely black at the extinction position to aid in the clarity the presentation. |  |
|
Sign of Elongation Some crystals tend to grow in elongated habits. When this is the case, note that they can be elongated parallel to their slow vibration direction or parallel to their fast vibration direction.
|
| To determine the sign of elongation, place the crystal so that it is in a position where the long direction of the crystal is parallel to the slow direction in the compensator. |
| Observe an area that shows a 1o
gray interference color (usually along the thin edges of the crystal) with
the analyzer inserted. If this 1o gray area turns to 2o
blue, addition has occurred telling us that the slow direction in the
crystal is aligned with the slow direction of the compensator. This
crystal is length slow.
If, one the other hand, the 1o gray area turns yellow, it tells that subtraction has occurred, and the fast direction in the crystal is aligned with the slow direction in the compensator. The crystal is then said to be length fast. |
 |
| Note again, that the length slow/fast property only applies to crystals that always show a habit with a preferred direction of elongation. |
|
Absorption and Pleochroism Recall that in isotropic substances preferential absorption of different wavelengths of light may occur upon passage through the crystal. This results in light of wavelengths that are not absorbed being transmitted and combining to produce a certain color known as the absorption color (observed with the analyzer not inserted). Some uniaxial crystals have more than one absorption color because the different wavelengths are absorbed to different extents depending on the direction of vibration of the light as it passes through the crystal. When a crystal exhibits more than one absorption color it is said to have pleochroism. |
|
The relationship between the color of the crystal and the vibration direction for light is called the pleochroic formula. A uniaxial crystal that exhibits pleochroism will show this property best if the C-axis, or optic axis is parallel to the microscope stage, so that both of its principle vibration directions can be observed.
In the example shown below, the pleochroic formula is ω = yellow, ε = blue. That means that when the ω direction is parallel to the polarizer only light vibrating the ω direction will pass through the crystal, and it will show a yellow color. |
|
|
| When the ε direction is parallel to the polarizer only light vibrating in
the in the ε direction will pass through the
crystal and it will show the blue absorption color in the case
illustrated.
At intermediate positions the crystal will show a combination of the two colors, in this case green. Note also that if the optic axis is oriented perpendicular to the microscope stage, light will see only the ω vibration direction, and will thus only show the absorption color associated with the ω direction. This gives us another method for finding a grain oriented with its optic axis perpendicular to the microscope stage. If the mineral is pleochroic, a grain that shows no change in color on rotation of the stage is one with the optic axis oriented perpendicular to the stage. Such a grain should also give us a centered optic axis interference figure in conoscope mode. |
|
Abnormal (Anomalous) Interference Colors If a mineral has strong absorption of certain wavelengths of light, these same wavelengths will be absorbed by the crystal with the analyzer inserted, and thus the crystal may produce an abnormal or anomalous interference color, one that is not shown in the interference color chart. For example, imagine a crystal that shows strong absorption of all wavelengths of light except green. Thus, all other wavelengths are absorbed in the crystal and the only wavelengths present that can reach the analyzer are green. The crystal will thus show a green interference color that is not affected by the other wavelengths of light, and thus this green color will not appear in the interference color chart. |
Examples of questions on this material that could be asked on an exam
|