Single sequence reactions from cDNA libraries of specific tissues and culture conditions
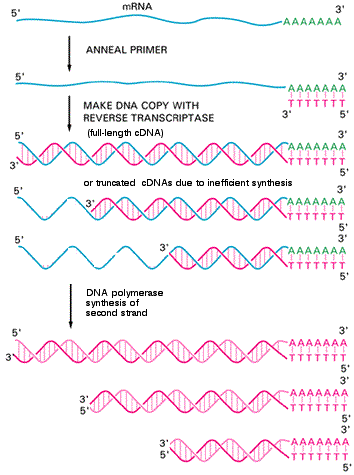
cDNAs are synthesized from mRNA mixture present in tissue of interest using reverse transcriptase.
Once cDNAs are synthesized, they are cloned into a vector for sequencing. Usually, they are cloned in a known orientation, so that sequence can be derived from the 3' end of the message or 5' end. Since full-length cDNAs are difficult to synthesize, different cDNA copies of the same mRNA may have different sequences at their 5' ends.
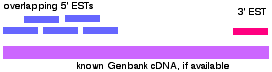
some ESTs may differ in sequence, due to variations in mRNA splicing.
sequences are assembled onto known full-length cDNAs from genbank, if known.
Assembly is called a UniGene - unique gene from which ESTs are derived.
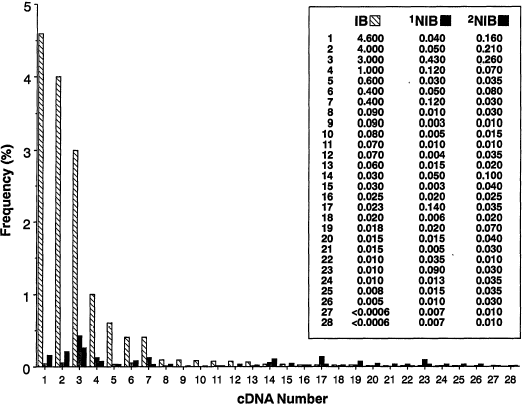
Once UniGenes determined, the EST can be used as a measure of gene expression within a tissue:
But this means a few genes can be represented by most of the ESTs
Normalizing cDNA library can reduce representation of most abundant sequences in a library, while allowing study of relative abundance of rarer transcripts
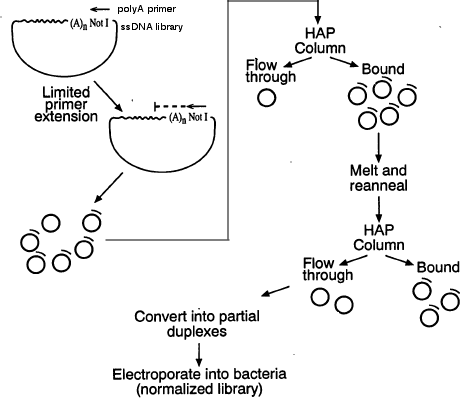
Normalization makes copies of one strand of cDNA Liberia and anneals it back to a opposite strand. Since annealing requires interaction of 2 molecules, it is concentration dependent, so most abundant messages cDNAs will likely anneal with opposite strand quickly. Rarer cDNAs take longer to find "mate", so they remain single stranded.
Hydroxlyappatite (HAP) column binds ds cDNAs, but not ssDNA, so HAP flowthrough contains more of the rarer messages.
So a few thousand sequence reactions of cDNA library from tissue of interest provides information on which sequences are being transcribed, and how highly they are expressed.
One can even compare results obtained in different tissue samples to get gene expression profile similar to microarray analysis. One tool for doing this is the DDD - Digital differential display program at NCBI. Expression patterns from any number of EST libraries can be compared. Where statistically significant differences are found for known UniGenes, they are represented as dots of differing intensities to show differences. See the example comparing organs of the body.
It is important to be careful about comparing differences between normalized and non-normalized libraries, since the normalization will greatly affect levels of abundant genes.
TAPtag genome analysis of complex formation