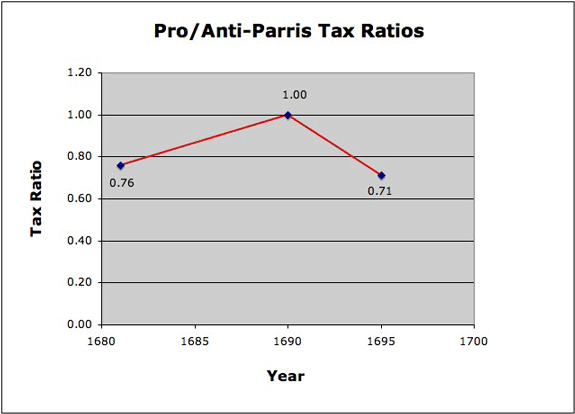
Faction Median Ratios:
1681-1695

Using the ratios of pro- and anti-Parris taxes already gathered, the economic condition of Salem Village's rival factions between 1681 and 1695 can be displayed by means of scatter plots. In a new worksheet, enter the tax years 1681, 1690, and 1695 in one column; in the adjoining column, enter the associated ratio of pro- to anti-Parris mean (or median) taxes for each year. Then select the two columns and choose the Chart Wizard's "XY (Scatter)" button.
The median ratio of pro- to anti-Parris taxes (see chart above), for example, illustrates the rising fortunes of the pro-Parris faction compared to its opponents in the decade preceding the witchcraft outbreak. But the ministry group's progress was reversed in the years following 1690, and by 1695, it had declined in wealth relative to witchcraft's opposition. Indeed, pro-Parris members were, relative to their opposition, worse off than they had been fifteen years before. Graphing the mean ratios of pro- to anti-Parris taxes shows a similar pattern.
Users can follow the same procedure to chart the median and average ratios of the pro-Parris and anti-Parris factions to Salem Villagers for the period from 1681 to 1695. The context provided by these plots raise questions about the economic advancement of the anti-Parris faction.
Salem Village's tax data allow for an even longer perspective on the economic standing of its factions. Download the 1700 Tax Data Set, and click Next.