Committee Pie Charts

Pie charts graphically show the relative sizes of the different political and social components of committee membership.
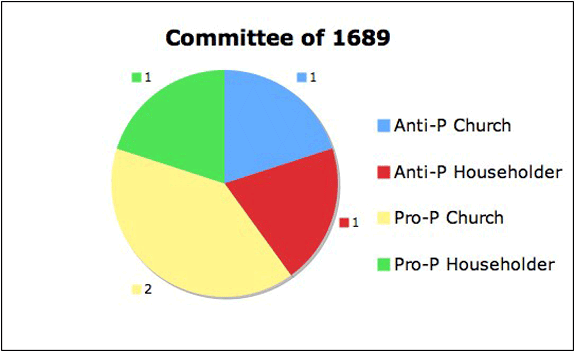
To display the four categories of the committee of 1689, create a new worksheet in Excel. In the top row of cells, label the four groups of members (Anti-P Church, Anti-P Householder, Pro-P Church, and Pro-P Householder). In the second row, copy the number of members in each group from the committee of 1689 pivot table.
| Anti-P Church | Anti-P Householder | Pro-P Church | Pro-P Householder |
| 1 | 1 | 2 | 1 |
Drag through the cells of the two rows to select them and open the Chart Wizard. Choose "Pie" (the two rows of cells will be identified in the "Data Range" window). The Rows button must be selected, indicating "series in" rows. The pie chart (see above) can be edited in the Chart Options window and in the completed chart by right-clicking the labels and selecting "Format Data Labels."
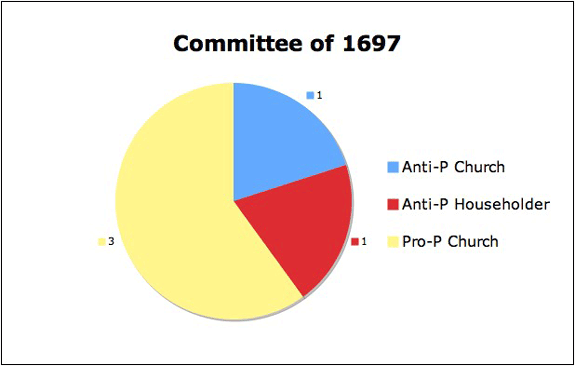
Similarly, to display the four categories of the committee of 1697, create a new worksheet in Excel. In the top row of cells, label the three groups of members (Anti-P Church, Anti-P Householder, and Pro-P Church). In the second row, copy the number of members in each group from the Committee of 1697 pivot table.
| Anti-P Church | Anti-P Householder | Pro-P Church |
| 1 | 1 | 3 |
Using the Chart Wizard, create a pie chart for this committee.

The charts display the association of pro-Parris committeemen with church membership. Among anti-Parris committeemen, the association with householding, while not as firm as in the committee of 1691, remains strong as compared to pro-Parris committeemen.
To return to the Committees of 1689 and 1697 page, click Back or Next.