Execution Discussion

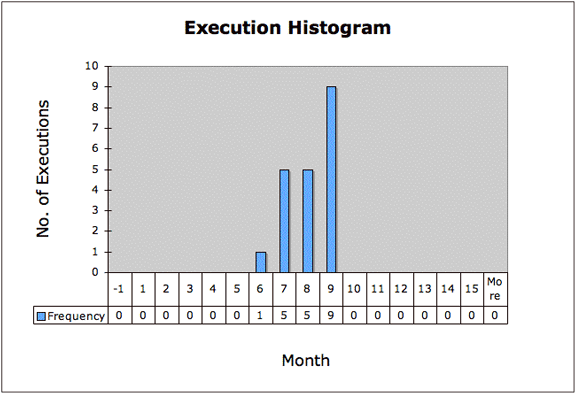
The execution histogram establishes the chronology and quantitative dimensions of Salem's executions. Whereas the first recorded accusations occurred in February 1692, the first execution did not take place until June (month 6). Following June's only execution, there was a distinct uptick of activity with five executions in both July and August, climaxing with nine in September. By the end of September, twenty accused witches had been put to death. But as was true of witchcraft accusations, a dramatic change occurred in October. There were no executions in October (or any month thereafter), paralleling the precipitous decline in accusations in the same month.
The timing of the Salem executions alerts us to the legal judicial dimensions of the Salem episode. The Court of Oyer and Terminer first convened on 2 June 1692 to consider the case of Bridget Bishop. Bishop was found guilty by the jury and executed on 10 June. No other executions occurred that month.
The reason for the sudden cession of executions after Bishop's execution, which accompanied the sharp drop in recorded accusations in June, cannot be known with certainty. But it was likely related to procedural concerns, particularly the reliance by judges and examining magistrates on spectral evidence — that is, the acceptance as valid evidence against the accused of harm allegedly committed by the accused's specters (rather than the accused themselves) as well as by familiars, such as spectral animals, associated with the accused. Some observer questioned whether the Devil might employ specters of innocent people or might directly implant images of the accused in the afflicted without permission of the accused. Might not the afflicted be possessed by the Devil rather than bewitched by the accused? The Court temporarily adjourned until the end of June, during which time, the judges and other officials sought advice from the colony's leading ministers as to how best to conduct the trials. This suspension of the legal machinery in June almost certainly explains the sharp decline of formal charges against witches as well as a stop in further trials and executions.
Led by Stoughton, the Court interpreted the ministers' advice as an endorsement to proceed with speed and vigor, and the Court resumed its meetings in a series of sessions held between 28 June and 17 September. The consequences are evident in both the accusation and execution histograms. But users interested in exploring June's missed opportunity to permanently close down the witch hunt's legal machinery should examine historical sources to consider who and what conditions were responsible for the renewal of the witch hunt.
As for the abrupt and permanent decline of executions in October graphically illustrated by the histogram, contemporary documents indicate that conditions in Massachusetts no longer favored the trials or additional accusations against witches. Support for the trials had never been universal, and as the outbreak swept more people and communities into its vortex, skepticism increased and opposition swelled. The accused were not just the usual suspects — old, poor, single women, for example. They included respected and even influential people whom it was difficult to consider susceptible of the Devil's blandishments. The Court of Oyer and Terminer, which was supposed to contain and eradicate the witchcraft threat, seemed itself to contribute to the turmoil and disarray. Something was clearly wrong. In October, Governor Phips responded to the changed climate of opinion by ordering an end to further arrests and halting the Court's proceedings. Although a few formal charges would still be filed, the decisiveness of Phips's actions and changing public sentiment in bringing and end to the witch hunt can be seen in the accusation and execution histograms.
A scatter plot presents data by means of a series of points that can be connected by a line. To construct a scatter plot of witchcraft executions in 1692, click Next.