| EENS 2110 |
Mineralogy |
| Tulane University |
Prof. Stephen A. Nelson |
|
Biaxial Minerals |
|
|
|
All minerals that crystallize in the orthorhombic, monoclinic, or
triclinic crystal systems are biaxial. Biaxial crystals have 2 optic
axes, and this distinguishes biaxial crystals from uniaxial
crystals. Like uniaxial crystals, biaxial crystals have refractive
indices that vary between two extremes, but also have a unique
intermediate refractive index. Biaxial refractive indices are as
follows:
All biaxial minerals have optical symmetry equivalent to 2/m2/m2/m. But, in each of the crystal systems, the optical directions have different correspondence to the crystallographic directions.
|
|
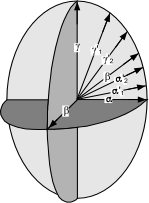
The Biaxial Indicatrix The biaxial indicatrix, like the isotropic and uniaxial indicatrices, diagrammatically illustrates the refractive index for vibration directions of light. It is shown in the diagram below. |
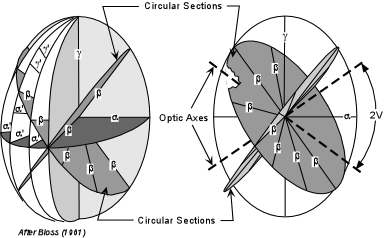
| The biaxial indicatrix has three principle axes, labeled α, β, and γ. Directions that have refractive indices between α and β, are referred to as α'. Directions with refractive indices between γ and β are referred to as γ'. Note that the β direction also must occur in the plane that includes α and γ. Similarly, if we were to draw all other possible planes that include the γ direction, β would have to occur in each of these as well. This results in two sections that would be circular with a radius equivalent to the β refractive index. These two sections are referred to as the circular sections. In the diagrams below we see the two circular sections, each having a radius equal to the β refractive index. |  |
| In the left-hand diagram some of the other possible planes that include γ
are shown. In the right-hand diagram these planes are removed to
show only the circular sections. Lines drawn perpendicular to the
circular sections are the optic axes. This is why minerals that
exhibit these optical properties are called biaxial.
The acute angle between the optic axes is called the 2V angle. |
 |
| Just like in uniaxial minerals, if one is looking down one of the optic axes, light traveling along the optic axis will be vibrating in the β direction, and thus the mineral would be extinct for all rotation positions. |
| The three principal planes of the biaxial indicatrix are shown here. The plane containing the α and γ directions also contains the optic axes, which are perpendicular to the β directions. This plane is called the optic axial plane or OAP. | 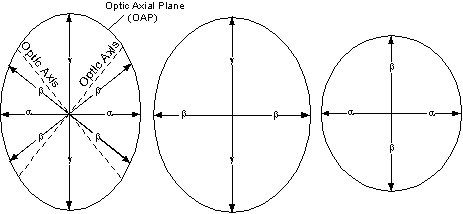 |
| The other two principal planes contain the γ
and β directions and the α
and β directions, respectively.
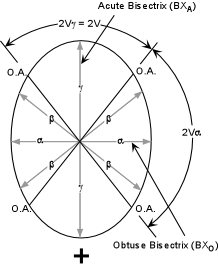
The optic sign of biaxial minerals depends on whether the β refractive index is closer to that of α or to γ. There are several ways that this can be stated, so we will look at all of them. |
Biaxial Positive
|
 |
Biaxial Negative
|
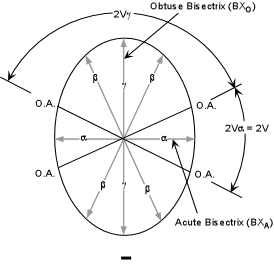 |
|
|
Optical Orientations of Biaxial Crystals Just like in uniaxial crystals, we can move the indicatrix around in a crystal so long as the indicatrix is kept parallel to the optical directions, and use this as an aid to determining the optical directions in the crystal. Several orientations are possible, the most general are shown in the diagram below. Note that in this diagram we have not shown the crystallographic axes, because different minerals will show different relationships between optical directions and crystallographic directions as discussed above. |
|
|
|
While knowledge of the optical directions can provide a means to measure the principle refractive indices, this is not often done because much of the information necessary to identify a biaxial mineral can be obtained from interference figures. |
|
Biaxial Interference Figures Four primary types of biaxial interference are seen. Only two of these are commonly used, but it is essential to discuss all four so that you can recognize each. Acute Bisectrix Figure (BXA) Looking down the acute bisectrix, (the γ direction perpendicular to the stage if the crystal is optically positive, or the α direction perpendicular to the stage if the crystal is negative), at 45o off extinction in conoscope mode, one would see the interference figure shown in the left-hand diagram below. |
|
|
As the stage is rotated 45o from this initial position, the isogyres will close to produce a cross. In this position the crystal would be extinct in orthoscope mode. The melatopes will be rotated so that both lie along the N-S cross hair. Rotation by an additional 45o will result in the isogyres then separating again to show the interference figure in the third diagram. Another 45o rotation will again cause the isogyres to close into a cross, this time with the OAP lying parallel to the polarizing direction of the microscope. The crystal would again be extinct in orthoscope mode. Another 45o rotation would return the view to the first diagram in the series. |
| Optic Axis Figure (OA)
If one of the optic axes is oriented perpendicular to the stage, placing the microscope in conoscope mode will result in an optic axis interference figure. This is similar to the BXA figure, except one of the isogyres and melatopes will be outside of the field of view (unless the 2V angle is very small). |
|
|
| During rotation of the stage, the melatope will remain at the cross-hair intersection and the isogyres will close to form an off-centered cross and then separate to show the curved isogyre in the adjacent quadrant of the field of view. |
|
OA figures are easiest to find among randomly oriented grains, because a grain that shows such a figure will show no change in relief on a 360o rotation (analyzer out), and will remain extinct through a 360o rotation (analyzer inserted). |
| Obtuse Bisectrix Figure (BXO)
A BXO figure will be similar to the BXA figure, except that the melatopes will be outside of the field of view most of the time during a 360o rotation. Still, every 90o the broad cross will form as the OAP becomes parallel to one of the cross hairs. |
| Optic Normal Figure (O.N.)
If the principal β direction of the indicatrix is oriented perpendicular to the stage, such that the crystal's privileged directions are α and γ, then changing to conoscope mode will produce an optic normal figure, also called a flash figure. In this figure, when one of the two privileged directions lines up with the polarizer, a broad cross covering almost the entire field of view will be observed. This cross, however will quickly disappear after just a slight rotation of the stage (this is why it is often called a flash figure). If one sees an optic normal figure, then the interference colors observed in orthoscope mode will reflect the absolute or maximum birefringence of the mineral, as discussed above.
|
|
Determination of Optic Sign Biaxial interference figures are most useful for the determination of optic sign and estimation of the 2V angle, both of which are useful diagnostic properties of biaxial minerals. The two most useful are the BXA figure and OA figure.
Acute Bisectrix Figure |
| To determine the optic sign of a biaxial mineral from a BXA figure, position the isogyres so that the melatopes are in the NE and SW quadrants. There should be an area near the melatopes that shows a 1o gray interference color. Observe this area as you insert the 550nm or 1o red compensator. If the 1o gray area in region between the two isogyres turns yellow, the mineral is biaxial positive. If the 1o gray area inside of both the isogyres turns yellow the mineral is biaxial negative. Note that it is easiest to remember this if you imagine the area inside the isogyres turns yellow and a line drawn inside the isogyres crosses the slow direction of the compensator like the vertical stroke on a plus sign. For a negative mineral, the line connecting the two yellow areas is parallel to the slow direction in the compensator, forming the minus sign. | 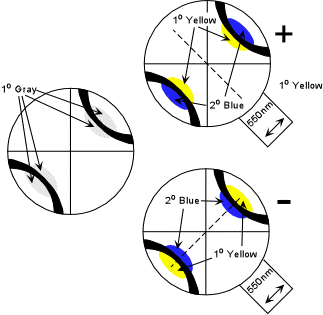 |
| Centered Optic Axis Figure Optic axis figures probably provide the easiest method for determination of optic sign because grains with an orientation that would produce an OA figure are perhaps the easiest to find. |
| The method is similar to the BXA figure, except you will be looking at only one of the isogyres. Again place the isogyre so that the inside of the isogyre is in the NW quadrant. Find the area that shows 1o gray close to the melatope. Observe this area as the 550 nm compensator plate is inserted. If the area outside of the isogyre turns yellow, the mineral is biaxial positive. If the area inside the isogyre turns yellow, the mineral is biaxial negative. | 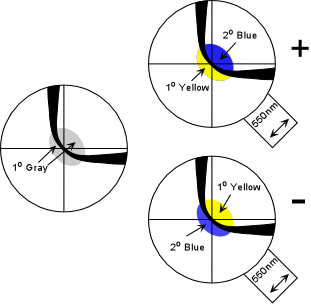 |
| Off-centered Figures Probably even easier to locate are off-centered OA or BXA interference figures. |
| The method for optic sign determination in off-centered figures is essentially the same as for BXA and OA figures. Position the isogyres so that it fits best in either the NE or SW quadrant. Observe the gray area near the melatopes and note the color change on insertion of the 550 nm compensator. If the gray area outside the isogyre turns yellow, the mineral is biaxial positive. If the gray area outside isogyre turns blue and the gray area inside the isogyre turns yellow, the mineral is biaxial negative. | 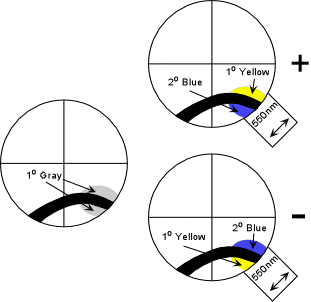 |
| How to Locate Different types of Biaxial Interference Figures
The best indicator of the type of interference figure a given grain
will produce is the level of interference colors exhibited by the grain in
orthoscope mode. Note that the O.N. figure will occur on
grains that show the maximum interference colors. Such a grain will
give the best indicator of the absolute birefringence of the
mineral. OA. figures and Off-centered OA figures will be easiest to
locate because the grain will either be completely extinct on a 360o
rotation (OA figure) or will show very low birefringence (off-centered
OA). |
Type of Interference Figure Level of Interference Colors O.N. Maximum BXO Relatively High BXA Relatively Low O.A. None Off-centered O.A. Very Low
| How to Distinguish Biaxial from Uniaxial Interference Figures Biaxial minerals can often be distinguished from uniaxial minerals on the basis of an interference figure. |
| To do so, rotate the stage until the isogyre rests on intersection of the cross hairs. If there is any curvature to the isogyre, the mineral is biaxial. If the isogyre is straight, then the mineral is either biaxial with a low 2V or is uniaxial. In the latter case further tests will have to made on other grains to make the distinction. | 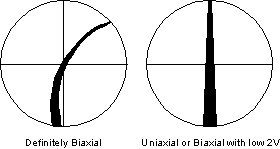 |
|
Estimation of 2V Precise determination of 2V can only be made by determining the 3 principal refractive indices of the mineral. But, 2V can be estimated from Acute Bisectrix figures and Optic Axis figures using the diagrams shown here. |
|
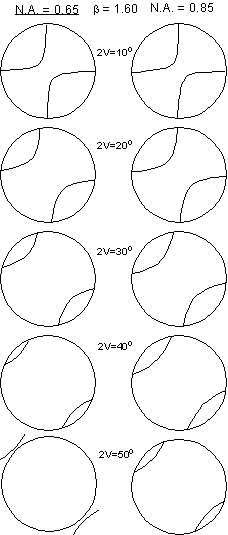
Acute Bisectrix Figure Recall that for a BXA figure the distance between the melatopes is proportional to the 2V angle. To estimate the 2V from a BXA figure, one first needs to know the numerical aperture (N.A.) of the objective lens used to observe the interference figure. The microscopes in our labs have an N.A. of 0.65, while research microscopes generally have a higher N.A. of 0.85. The diagram shown here gives a visual estimate of the 2V angle for objective lenses with these two values of N.A. for a mineral with a β refractive index of 1.6. Remember that if the 2V is 0o the mineral is uniaxial, and would thus show the uniaxial interference figure. The separation of the isogyres or melatopes increases with 2V and the isogyres eventually go outside of the field of view for a 2V of 50o with the smaller N.A., and about 60o for the larger N.A. |
 |
| Since the maximum 2V that can be observed for a BXA figure depends on the β refractive index, the chart shown here may be useful to obtain more precise estimates if the β refractive index is known or can be measured. | 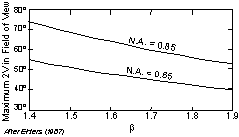 |
| Optic Axis Figure
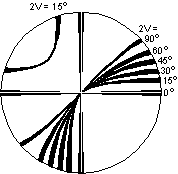
2V estimates can be made on an optic axis figure by noting the curvature of the isogyres and referring to the diagram shown here. Note that the curvature is most for low values of 2V and decreases to where the isogyre essentially forms a straight line across the field of view for a 2V of 90o. For a 2V of 0o the mineral is uniaxial and the isogyres form a cross with straight isogyres. |
 |
|
Extinction Angle Extinction angle is the property that involves determining the angle between the a crystallographic direction as exhibited by a crystal face or cleavage and one of the principal vibration directions. We have already discussed parallel and symmetrical extinction in uniaxial minerals. The concept is the same for Biaxial minerals, except that the extinction angles could be different from 90o or 0o, as is the case for parallel extinction. Three different cases are observed depending on whether the mineral is orthorhombic, monoclinic, or triclinic. Orthorhombic Minerals In orthorhombic minerals the principal vibration directions are coincident with the 3 crystallographic axes. Thus, for most orientations of the mineral on the stage, cleavages that are parallel to a crystallographic axis will show extinction that is parallel to or at 90o to such a cleavage. |
| Shown here on the left is an orthorhombic mineral with {010} cleavage. Since this cleavage is parallel to the a and c crystallographic axes, and since the α, β, and γ vibration directions are also parallel to the a, b, and c axes, this mineral will show parallel extinction with respect to the {010} cleavage. | 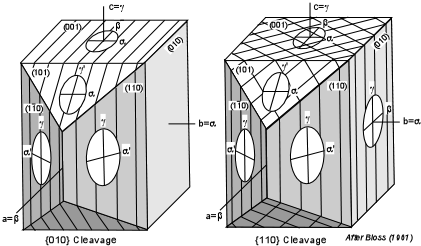 |
| On the right is an orthorhombic mineral with {110} cleavage.
Again, since the cleavage is parallel to the c crystallographic axis, and
one of the principal vibration directions is also parallel to the c axis,
the mineral will show parallel extinction if the mineral is lying on any
face parallel to the c axis [i.e. (010), (110)] or any other random face
such as (210), (130), etc. (not shown in the diagram).
If the crystal is lying on a face that is not parallel to the c axis, it will show symmetrical extinction with respect to the cleavages. |
| Monoclinic Minerals
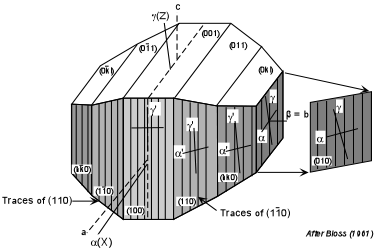
In monoclinic crystals, only one of the principal vibration directions will coincide with a crystallographic axis. The others will be at some angle to the crystallographic axes. |
| In the case shown here, a monoclinic mineral with {110} cleavage will
show extinction at some angle other than 0o or 90o
to the cleavage direction. This angle will vary from some maximum angle
to 0o, depending on which crystal face is parallel to the
stage. In the case shown here, the maximum angle will be seen if one
is looking down the b axis or β direction,
that is the face (010) [or (0 |
 |
| This is important, because if a mineral is reported to have inclined
extinction with respect to a cleavage, note that it is possible, given the
right orientation of the grain, for the mineral to exhibit parallel
extinction.
For minerals that show inclined extinction, tables of determinative properties usually list the maximum extinction angle in the form γ ∠ c or Z∠ c. |
| Triclinic Minerals
In triclinic minerals none of the principal vibration directions are
constrained to coincide with crystallographic directions. Thus, asymmetrical
and inclined extinction are to be expected. Again, in tables of
determinative properties of minerals the maximum extinction angle will be
given in a form such as γ∠ c or Z∠ c. Also, note that there will be some
orientation of the grain where the extinction will be parallel, so
extinction angle should be tested on several grains of the same mineral.
|
|
Sign of Elongation For minerals that commonly show an elongated habit, the
sign of elongation could be an important property. In biaxial
minerals sign of elongation is only important if the mineral tends to be
elongated in the direction of either γ or α,
since these are the maximum and minimum refractive indices. Sign of
elongation is determined by positioning the grain so that its elongation
direction is parallel to the slow direction of the compensator.
Before inserting the compensator find an area near the edge of the grain
that shows a 1o gray interference color. If the gray area
turns blue then the mineral's slow direction (γ
direction) is parallel to the slow direction in the compensator. If
the gray areas turns yellow, then the mineral's fast direction (α
direction) is parallel to the slow direction in the compensator. |
| Note that sign of elongation is usually not reported for minerals that are elongated in the β direction, since some faces would show length fast, and other faces would show length slow. | 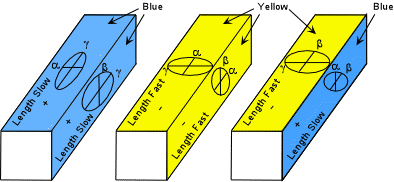 |
|
As discussed under uniaxial minerals, pleochroism is the property where the mineral shows a different absorption color associated with different vibration directions. In uniaxial minerals the two main vibration directions could have different absorption colors, and any intermediate direction would show an intermediate color. In biaxial crystals, three different absorption colors are possible, one associated with each of the principal indices. Intermediate directions will give intermediate colors. The pleochroic formula is usually given in terms of the three principal refractive indices, for example a biaxial mineral could have the pleochroic formula α = red, β = pink, γ = clear. Of course, since only two vibration directions can be observed at any one time, only two of the colors will be seen on rotation of a given grain. Thus, several grains of the same mineral must be observed in order to determine the pleochroic formula of the mineral. |
|
Other Observations We here discuss some other properties that may be exhibited by some minerals. If any of these occur, they may be useful diagnostic features of the mineral. |
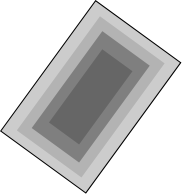
| Zoning
Zoning occurs as a result of incomplete reaction of solid solutions and results in the chemical composition of the mineral changing through the mineral. Optical properties, depend on chemical composition, and thus if the composition changes through a crystal, the optical properties will vary through the crystal as well. In particular, the orientation of the principal vibration directions may change, and thus the angle at which the mineral goes extinct may change. This can be observed by rotating a zoned crystal and noting that the whole crystal does not go extinct all at once. Each part that goes extinct at the same time or has the same interference color at the same time has a chemical composition distinct from other parts of the same crystal. |
 |
| Twinning
Since twinning is an intergrowth of two or more crystals, optical properties will change at the boundaries between twins. |
| Thus, different parts of the crystal will go extinct at different times as a result of twin planes. Plagioclase polysynthetic twinning is seen as dark and light colored stripes running through the crystal under crossed polars (left-hand illustration). Cyclical twins and simple contact twins are shown in the other illustrations. | 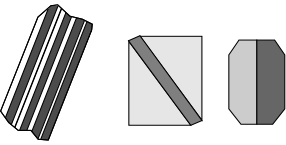 |
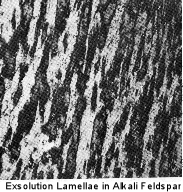
| Exsolution Lamellae
Some minerals that form solid solutions at high temperature exsolve as they pass through lower temperatures. This exsolution often results in domains of one mineral inside of the other, called exsolution lamellae. This is very common in the alkali feldspars that occur in plutonic igneous rocks, as shown here. It also occurs in other minerals, particularly the pyroxenes. When exsolution lamellae are present, they can be very diagnostic of the mineral.
|
 |
|
Undulatory Extinction Deformation of minerals can result in strain of the crystal structure, which causes different parts of the same mineral to have different crystallographic and therefore optical orientations. When this occurs, the parts of the crystal with different orientations will go extinct at different rotational positions. This is referred to as undulatory extinction. It is common in quartz found in metamorphic rocks. |
 |
|
Abnormal Interference Colors As discussed under uniaxial minerals, if a mineral has strong absorption of certain wavelengths
of light, these same wavelengths will be absorbed by the crystal with the
analyzer inserted, and thus the crystal may produce an abnormal or anomalous
interference color, one that is not shown in the interference color
chart. For example, imagine a crystal that shows strong absorption
of all wavelengths of light except green. Thus, all other
wavelengths are absorbed in the crystal and the only wavelengths present
that can reach the analyzer are green. The crystal will thus show a
green interference color that is not effected by the other wavelengths of
light, and thus this green color will not appear in the interference color
chart. When a mineral exhibits abnormal interference colors, it will
usually be listed as one of the diagnostic properties. Associations Some minerals commonly occur with other minerals in the same rock due to the chemical composition of the rock. Likewise, some minerals do not occur in association with other minerals. Mineral associations can be very useful diagnostic properties. For example, nepheline and quartz do not usually occur with one another, nor does Mg-rich olivine and quartz. Thus, if you see quartz in a rock, you will not likely find Mg-rich olivine or nepheline. Aluminous schists, result from metamorphism of shales, which contain an abundance of Al-rich clay minerals. So, we expect to find Al-rich minerals in aluminous schists, like garnet, muscovite, alkali feldspar, biotite, and an Al2SiO5 mineral like kyanite, andalusite, or sillimanite. Mineral associations often make mineral identification much easier because you know what minerals to expect. These will be discussed to a much greater extent in EENS 2120, Petrology. In your Deer, Howie and Zussman book, mineral associations are referred to as Paragenesis. |
|
Summary of Optical Properties
|
|
Examples of questions on this material that could be asked on an exam
|