EENS 2110 |
Mineralogy |
Tulane University |
Prof. Stephen A. Nelson |
Mineral Chemistry |
|
Minerals can form by any of the following processes:
No matter what process is involved, a particular mineral cannot form unless the chemical ingredients necessary to make the mineral are present. Thus, the most common minerals are minerals that have a chemical composition made of the common elements found in their environment. Since the environment where most observable minerals occur is the Earth's crust, we must first explore the chemical composition of the Earth's crust. |
Composition of the Crust
Based on information compiled by Clarke and Washington in 1924, the average
composition of the continental crust is as follows:
|
Element Wt% Atomic% Volume% O 46.60 62.55 ~94 Si 27.72 21.22 ~6 Al 8.13 6.47 Fe 5.00 1.92 Ca 3.63 1.94 Na 2.83 2.34 K 2.59 1.42 Mg 2.09 1.84 Total 98.59 100.00 100
Note that 8 elements make up over 98% of the Earth's crust and that Oxygen
is the most abundant element. This becomes even more evident if the
elements are determined on an atomic basis, where we can see that about 63
out of every 100 atoms in the crust are Oxygen. On a volume basis,
Oxygen makes up about 94% of the crust because Oxygen is a
large anion, and the other elements occur as small cations coordinated by
the Oxygen anions, as we discussed in the previous lecture.
Because of the average composition of the crust, the most common minerals found in the crust are silicates and oxides. Of the silicates, the aluminosilicates, like the feldspars and clay minerals are the most common. Other minerals, containing the other elements in the periodic table are found in the crust. But, in order for these minerals to occur, special geologic conditions are necessary to concentrate these less abundant elements so that they occur in high enough concentrations to form a separate mineral. Elements that occur in concentrations less than about 0.1% (usually measured in parts per million or parts per billion) are called dispersed elements or trace elements. A complete listing of the abundances of all elements in the Earth's crust can be found at http://www.science.co.il/PTelements.asp?s=Earth. |
Methods of Chemical Analysis While the common minerals are made up mostly of the abundant elements in the Crust, and we can express the chemical composition of such minerals by a simple (and sometimes not so simple) chemical formula, all minerals exhibit some chemical variation. In fact pure minerals (those with a chemical composition exactly the same as the chemical formula) are rarely found in nature. We will discuss why this is the case later on in the lecture. For now, it is sufficient to say that if we had a technique for measuring even the smallest concentrations of elements, we would see that any given mineral probably contains every stable element in the periodic table. Of course most of these elements would occur in very low concentrations (parts per trillion or less), nevertheless they are present. |
Various methods have been used to perform chemical analyses of rocks and minerals. We will discuss some of these techniques here. But, analysis of minerals is quite different from analysis of rocks. Chemical analysis of rocks involves analyzing an aggregate of minerals. So, in most case the rock can be ground to a fine powder and subjected to one of the methods discussed here. Analysis of a mineral is more complicated because:
Here we discuss only the more commonly used methods of mineral analysis. |
Wet Chemical Analyses
Prior to about 1960 classical wet chemical analysis was the only means of determining the chemical composition of minerals. Such analyses were limited by the factors discussed above in terms of sampling size, although techniques were developed for analyzing very small samples. Wet chemical analyses always involves dissolving the mineral into an acidic solution. In order for the dissolution to take place completely, the mineral is usually first ground into a fine powder (to increase surface area) and the appropriate acid must be used. Wet chemical analysis can be classified into three different types:
Generally all elements cannot be determined by the same wet chemical
methods and different methods are more sensitive for different
elements. Thus, complete wet chemical analysis usually involves a
combination of methods. Wet chemical analyses require a skilled
analytical chemist, and are usually very time consuming.
|
Inductively Coupled Plasma - Mass Spectrometry (ICP-MS) ICP-MS combines two instruments, an inductively coupled plasma spectrometer and a mass spectrometer to simultaneously measure most elements in the periodic table and determine concentration down to the sub part-per trillion (ppt) level. The sample of mineral or rock must first be powdered and put into solution in acid. This solution is then injected into a plasma as an aerosol where the atoms in the sample are ionized. The plasma is produced by passing Ar gas into an energy field induced by a radiofrequency (RF) generating coil. The RF energy field causes collisions between the Ar atoms, generating a high energy plasma. The sample aerosol is instantly decomposed in the plasma (temperature of 6,000 - 10,000 K) to form analyte atoms which are simultaneously ionized. The ions produced are extracted from the plasma into a mass spectrometer which is held at high vacuum. The mass analyzer then separates the ions based on their mass/charge ratio. The mass analyzer is essentially four parallel molybdenum rods to which a combination of RF and DC voltages are applied. The combination of these voltages allows the analyzer to transmit only ions of a specific mass/charge ratio. Finally, the ions are measured using an electron multiplier, and are collected by a counter for each mass number. The mass spectrum generated is extremely simple. Each elemental isotope appears at a different mass (i.e.. 27Al would appear at 27 amu) with a peak intensity directly proportional to the initial concentration of that isotope. The proportionality is determined using standard solutions with known concentrations of elements. Small parts of solid mineral samples can also be analyzed using the ICP-MS with an attached laser. The laser is focused on the part of the sample of interest and the power is increased to cause melting of that small part of the sample (this is called laser ablation). The melt is then injected into the plasma and the rest of the analysis is similar to that described above. This is a relatively new technique that is continually improving in terms of detection limit and reproducibility. |
X-ray Fluorescence (XRF) Spectrometry XRF spectrometry uses some of the same principles we discussed in our
lecture on X-ray diffraction. It is a technique now used mainly for
the analysis of rocks because it requires relatively large amounts of
sample (about 1 gram). It can be used to measure all of the major
elements in a rock or mineral as well as a wide variety of trace elements.
Sample preparation involves grinding the rock or mineral to find powder
and either pressing the powder into a pill or melting and quenching the
sample to make a glass disk. |
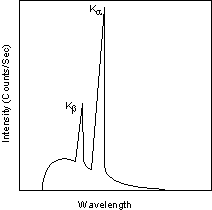
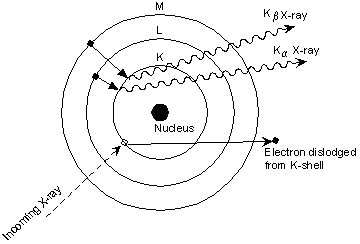
Recall from our previous discussion that when an electron is be
dislodged from an inner electron shell, outer shell electrons fall in to take
its place resulting in the production of X-rays with a wavelength
that is characteristic of the element involved. In X-ray diffraction, a beam of electrons
is used to dislodge the inner shell electrons and to
produce X-rays of known wavelength in the anode target of the X-ray
tube. In XRF, however, we use the X-rays from the X-ray tube to dislodge the electrons in atoms of an unknown sample.
|
Just like in the X-ray tube, inner shell electrons that are dislodged from atoms in the unknown sample result in the production of X-rays of characteristic wavelength for each of the different atoms in the sample. For each atom in the sample, the intensity of the characteristic X-rays will be proportional to the number of atoms in the sample. Thus, if we can measure the intensity of characteristic X-rays for each element, we can compare the intensity to that of a standard with known concentration, and determine the concentration of the element in the unknown. |
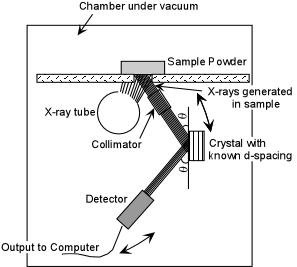
The instrument used for such measurements is called an X-ray Fluorescence Spectrometer. It consists of an X-ray tube to produce X-rays capable of dislodging inner shell electrons of all elements of interest in the sample These have to be high energy X-rays, so Cr, Mo, W, and Au targets are used as the anode. The X-rays that are produced in the sample are then sent through a collimator to produce a coherent beam. These are then diffracted through a crystal of known d-spacing. Using the Bragg equation (nl = 2dsinq) we can determine the q angle that X-rays of known wavelength will be diffracted through the crystal. Thus, the crystal and detector are set up to diffract only X-rays of the particular wavelength of interest into the detector. |
Intensities of characteristic X-rays for each element of interest are
determined by rotating the crystal and detector to the angle q
required for diffraction of the characteristic X-ray
wavelength. X-ray intensities are then measured for each element in the unknown and
for each element in a standard that has known concentrations. The
following equations are then used to determine the concentration of each
element in the unknown:
where Cistd = the concentration of element i in the standard, Iistd = the intensity of X-rays of element i in the standard, Ciunk = the concentration of element i in the unknown, Iiunk = the intensity of X-rays of element i in the unknown, and k = a proportionality constant. |
The proportionality constant, k, can be determined from the first equation:
This can then be substituted into the second equation to solve for the concentration of element i in the unknown:
In practice, this is only true if all elements in the standard and the unknown occur in about the same concentration. This is often difficult to attain, so a wide variety of standards are used to figure out all of the interfering effects and make a calibration curve which relates concentration in the unknown to a more complex equation involving the concentration and intensities in the standard. |
Electron Microprobe (EMP)
Analysis
The electron microprobe is an instrument that uses principles similar to XRF. The main difference is that instead of using X-rays to dislodge inner shell electrons of elements in the unknown, an electron beam is used. The electron beam can be focused down to a spot size of about 1 mm (1mm = 10-6m), and thus the X-rays in the sample will only be generated within a very small volume of the sample. Thus, one can measure the concentrations in small parts of single mineral grains, and chemical zoning patterns or changes in the concentration of elements through an individual grain can be determined. The sample can either be a highly polished thin section of a rock or mineral or can be grain mounts wherein individual grains are mounted in epoxy and polished to a smooth surface. |
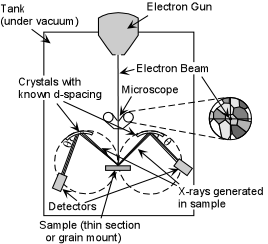
The instrument consists of a large tank that is evacuated to produce a vacuum. At the top is an electron gun that has a filament, similar to that in an X-ray tube, that generates electrons. The electron beam is accelerated down to a sample stage that is moveable. The electron beam is focused to a diameter of about 1 mm by a series of magnets along its path. Most electron microprobes have at least 3 X-ray spectrometers inside, so that more than one element can be measured at once. A microscope with binocular viewfinders allows the user to focus the electron beam anywhere on the sample, as shown in the inset. This can be accomplished by moving the sample stage. |
Electrons striking the small area of the sample produce X-rays with wavelengths characteristic of the elements in the sample. The spectrometers consist of curved crystals of known d-spacing. These crystals diffract X-rays of each element into the detectors at the diffraction angle q. Several elements can be measured at once, then the spectrometers are set to new angles to measure the X-ray intensities of several more elements. |
Just like in XRF analyses, standards have to measured to determine the proportionality constants or calibration curves, and equations similar to those used in the XRF method are used to determine element concentrations in the unknowns. Electron microprobe analysis is useful for determining the major element concentration in small parts of minerals. But, it is much less sensitive than the XRF in terms of trace element concentrations. |
Compositional Variation in Minerals In our definition of a mineral we said that a mineral has a definite, but not necessarily fixed chemical composition. Here we explore the "not necessarily fixed" portion of the definition. Chemical compositional variation in minerals is referred to solid solution. Although most of us think of solutions as a liquid containing dissolved ions, solids can form solutions as well, in which case we think of one solid as being dissolved in another solid. Solid solution occurs as the result of ions substituting for one another in a crystal structure. The factors that control the amount of solid solution that can take place in any given crystal structure are:
Three different types of solid solution are recognized - substitutional, interstitial, and omission.
Substitutional Solid Solution
|
Substitution | Ionic Radii (C.N.) Å | Type | Examples | |
Fe+2 <=> Mg+2 | Fe+2(6) 0.78 | Mg+2(6) 0.72 | Complete High T favors Mg. |
Olivines: Mg2SiO4 - Fe2SiO4 Pyroxenes: MgSiO3 - FeSiO3 CaMgSi2O6 - CaFeSi2O6 Biotite: KMg3AlSi3O10(OH)2 - KFe3AlSi3O10(OH)2 Tremolite Ca2Mg5Si8O22(OH)2 - Ferroactinolite Ca2Fe5Si8O22(OH)2 |
Fe+2 <=> Mn+2 | Fe+2(6) 0.78 | Mn+2(6) 0.83 | Complete, but limited by amt. of Mn available. |
Siderite Fe(CO)3 - Rhodochrosite - Mn(CO)3 |
Mg+2 <=> Mn+2 | Mg+2(6) 0.72 | Mn+2(6) 0.83 | Partial | |
Na+1 <=> K+1 | Na+1 (8) 1.18 | K+1(8) 1.51 | Complete at high T Partial at low T |
Alkali Feldspars: NaAlSi3O8 - KAlSi3O8 |
Fe+3 <=> Al+3 | Fe+3 (6) 0 .65 | Al+3 (6) 0.54 | Limited | Alkali Feldspar |
Br-1 <=> Cl-1 | Br-1(6) 1.96 | Cl-1(6) 1.81 | Complete | KCl - KBr |
(OH)-1 <=> F-1 | (OH)-1 (4) 1.38 | F-1(4) 1.31 | Complete | Biotite: K(Mg,Fe)3AlSi3O10(OH,F)2 |
|
Substitution Extent Example(s) Na+1Si+4 <=> Ca+2Al+3 Complete Plagioclase: NaAlSi3O8 - CaAl2Si2O8 Ca+2Mg+2 <=> Na+1Al+3 Limited Diopside: CaMgSi2O6 - Jadeite: NaAlSi2O6 Mg+22Al+3 <=> 2Fe+2Ti+4 Extensive Spinels
|
Interstitial Solid Solution In some crystal structures there are sites that are not normally occupied by ions. These are considered voids. However, when an ion does occupy one of these voids it is called interstitial solid solution.
|
Omission Solid Solution
Omission solid solution occurs when an ion of higher charge substitutes for an ion of lower charge. In order to maintain charge balance, two of the lower charged ions will be replaced, but the higher charged ion will occupy only one site, thus the other site will become vacant, or omitted.
An example of this type of solid solution is found in the blue variety of microcline, in which a Pb+2 ion replaces 2 K+1 ions. One of the K sites is replaced by the Pb+2 and the other site is left vacant. |
Exsolution
As mentioned above, the extent of solid solution is sometimes dependent on temperature and pressure since the sizes of ions and the sizes of the crystallographic sites can change with temperature and pressure. Thus, some minerals show complete solid solution under one set of temperature/pressure conditions, and only limited solid solution under different temperature/pressure conditions. When the conditions change to those where limited solid solution is favored, the mineral exsolves or unmixes. But, because the process is taking place in the solid state, exsolution or unmixing cannot easily form two separate phases, because the ions must diffuse through the solid. In fact, what happens is that two separate phases form in discrete domains within a single mineral grain. These domains are crystallographically oriented, so they appear as lamellae or lines across the mineral grain.
Although we will explore this further in our discussion of phase diagrams, an example is given here. The alkali feldspars (albite - NaAlSi3O8 - orthoclase - KAlSi3O8) form a complete solid solution at high temperature. At lower temperature the solid solution becomes progressively more limited, and as a result lamellae of albite-rich feldspar begin to grow in the orthoclase-rich alkali feldspar. This produces a texture called perthite, where the lighter colored albite-rich feldspar is seen to occur as irregular lines or streaks (the lamellae) within the pink orthoclase-rich feldspar. In the case of perthite, the exsolution lamellae are often large enough to see with the naked eye. In other systems, the exsolution lamellae can only be observed with the petrographic microscope. Photographic examples of exsolution lamellae can be seen in your textbook on page 549 (fig. 12.73). |
Graphical Representation of Mineral Composition For simple compositional variation it is often convenient to visualize the compositions in some kind of graphical form. Most chemical analyses of oxide and silicate minerals are reported in weight % oxide components. In weight percent because the classical technique of chemical analyses was once gravimetric, and in oxide components because it is difficult to obtain concentrations of Oxygen, so in oxides and silicates it is assumed that there is enough Oxygen to balance the cationic charges. |
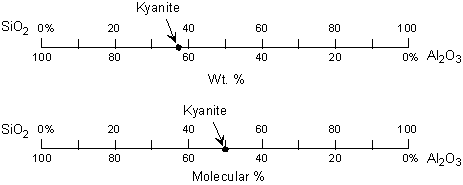
If the composition of a mineral can be expressed with 2 components, then a linear scale can be used as a graphical representation of composition. For example, chemical analysis of the mineral kyanite shows that it is composed of about 36 weight % SiO2 and 64 weight % Al2O3. |
We can plot this on a linear scale as shown here in the upper diagram. Note that in this two component compositional diagram 0% plots at the same point as 100 % . |
We could divide each of these weight percentages by the molecular weight of each of the oxides and recalculate in the analysis in terms of molecular %. But the chemical formula of Kyanite - Al2SiO5 - tells us that kyanite is made up of 1Al2O3 + 1SiO2 . So in molecular percent 50% of kyanite is Al2O3 and 50% is SiO2, as shown in the lower diagram above. |
Similarly, olivine can be thought of as a mixture of forsterite, Fo (Mg2SiO4) and fayalite, Fa (Fe2SiO4). If these are the only two components involved, then note again that 100% Fo corresponds to 0% Fa, and vice versa. |
An olivine solid solution that has 50% of the Mg+2 ions replaced by Fe+2 ions would be said to have a composition Fo50 or Fa50. Note that it could be expressed either way, because both ways indicate the same composition. The chemical formula for such a composition would be written as MgFeSiO4. Similarly, for an olivine composition where 20% of the Fe+2 ions are replaced by Mg+2 ions, the composition could be expressed as Fa20 or Fo80. |
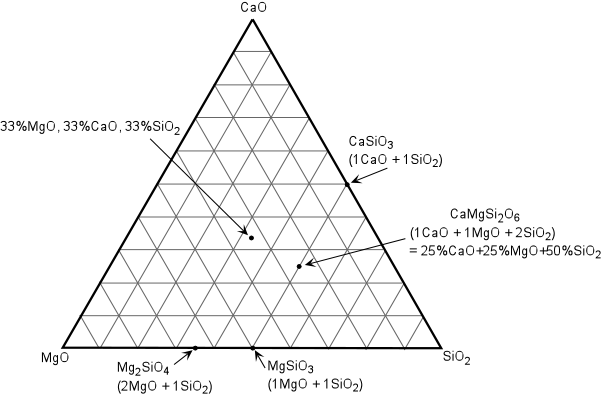
If there are three components that need to be plotted, a triangular graph can be used. Such a graph for the three components MgO, CaO, SiO2 is shown below. |
Each of the corners of the triangular graph represent 100% of the
component plotted at that corner, and 0% of the other two
components. Lines parallel to the sides of the triangle in this case
are marked off in 10% increments, so that the horizontals lines represent
the % of CaO starting from 0% at the bottom to 100% at the CaO
corner. Lines parallel to the SiO2 - CaO side of the
triangle represent the %MgO starting from 0% at the SiO2 - CaO
join to 100% MgO at the MgO corner. Lines parallel to the MgO - CaO
side of the diagram represent the % SiO2.
Note that the composition 33%MgO, 33%CaO, 33%SiO2 plots at the exact center of the triangle. Minerals that only contain 2 of the three components plot along the sides of the triangle, with the scale being similar to the 2-component graphs discussed above. So, for example if we are using molecular percentages,
|
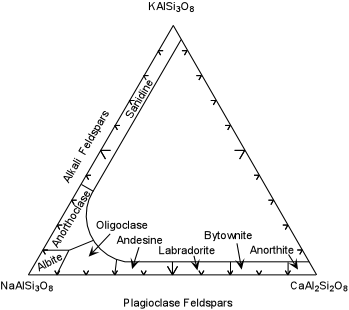
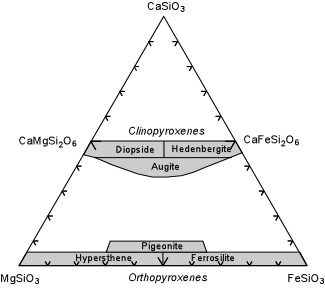
Triangular diagrams are often used to show the compositional ranges in minerals. We here look at 2 examples. |
The feldspars can be looked at in terms of the three components Albite (Ab) - NaAlSi3O8, Orthoclase (Or) - KALSi3O8, and Anorthite (An) - CaAl2Si2O8. At high temperature, complete solid solution exists between Ab and Or, to form the alkali feldspar solid solution series. But, as shown in the diagram, the alkali feldspar solid solutions can contain up to 5% of the An component. Similarly a complete solid solution series exists between Ab and An, to form the plagioclase solid solution series. Plagioclase can contain up to about 5% of the Or component. |
Another example is shown by the pyroxene minerals. These plot in the three component system Enstatite (En) - MgSiO3, Wollastonite (Wo) - CaSiO3, Ferrosilite (Fs) - FeSiO3. Wo does not have a pyroxene structure Complete solid solution exists between Diopside, Di, (CaMgSi2O6) and Hedenbergite, Hd, (CaFeSi2O6). These pyroxenes are monoclinic and are thus called the clinopyroxenes. Augite is also a clinopyroxene, but note that it is depleted in the Wo component relative to the Di - Hd series. En - Fs also forms a complete solid solution series. These minerals are orthorhombic, so the series is often referred to the orthopyroxenes.. Pigeonite is a monoclinic pyroxene that has slightly more of the Wo component than the orthopyroxenes. |
Examples of questions on this material that could be asked on an exam
|