Frequency
If you want to find the secrets of the Universe, think in terms of energy, frequency and vibration.
Attributed to Nikola Tesla
Frequency is what you know. Frequency is your identity.
Questions
What does it mean to say that you do something frequently?
Can anything grow without limit?
What is equilibrium? Are you at equilibrium?
What is a system? Do you have a system?
What is randomness? Do you do anything randomly? Are your grades random?
What is chaos? Do you do anything chaotically? Are your grades chaotic?
Is chaos the same thing as randomness?
What is noise? Are you noisy? Are your grades noisy?
An absence of frequency
As a gentle introduction to frequency, let us start with something that doesn’t have a frequency.
Todo
A pendulum at equilibrium?
A mathematical example
Todo
apparatus for drawing sine from pendulum
A simple illustration can be found in the next diagram of the graphs of two sine functions:
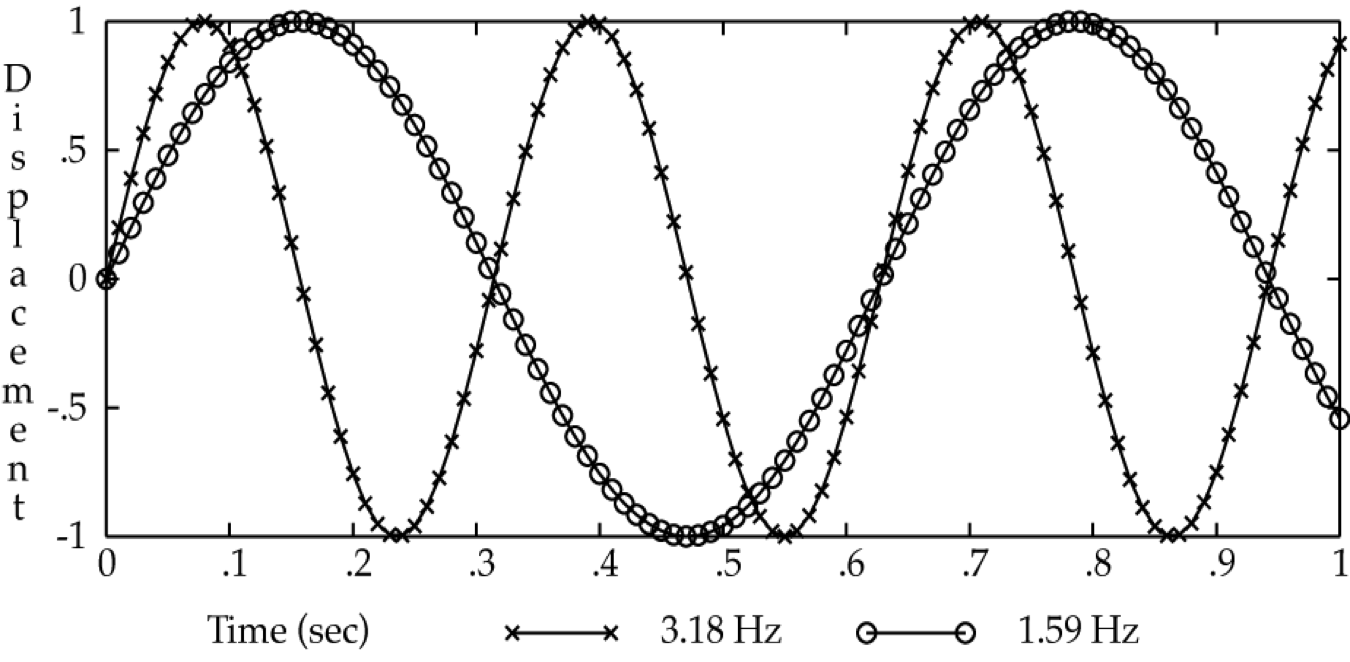
Fig. 1 Graph of two sine functions with different frequencies.
Author’s image.
The one marked with o’s, like beads on a necklace, completes an entire cycle in 0.628 s. The other wave, marked with x’s so that it looks like barbed wire, completes two cycles in this period.
As you can see, the shorter the cycle, the higher the frequency, which defines an inverse relation. Mathematically, where f stands for frequency and T for the time period, we have:
You can calculate the frequency of the two examples as \(1/0.628 = 1.59 Hz\) and \(1/1.256 = 3.18 Hz\).
Electromagnetic frequency
To get us started, do you know the answer to this question?
Question
What produces a rainbow?
As explained at the beginning of the fourteenth century by Theodoric of Freiberg and Kamāl al-Dīn al-Fārisī – independently – it is because droplets of water act like prisms that refract white light into its component frequencies, as seen in this single image taken from the magnificent animation in Wikipedia’s Prism article:
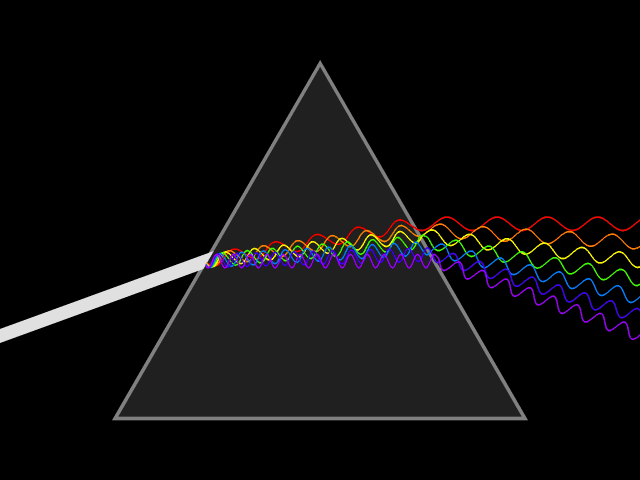
Fig. 2 A triangular prism refracts white light into the colors of the rainbow
Another question:
Question
Which color has the lowest frequency and which, the highest?
One of the few things that I remember that I learned in high school was ROYGBIV, the acronym for the ordering of the colors of the rainbow as “Red, Orange, Yellow, Green, Blue, Indigo, Violet”. The image shows you why this is the order: the prism splits the colors by frequency, with the lowest frequency/longest wavelength red at the top and highest frequency/shortest wavelength indigo at the bottom. Such a collection or continuum of frequencies is known as a spectrum. The image below paints a more traditional piecture of the spectrum of visible light:
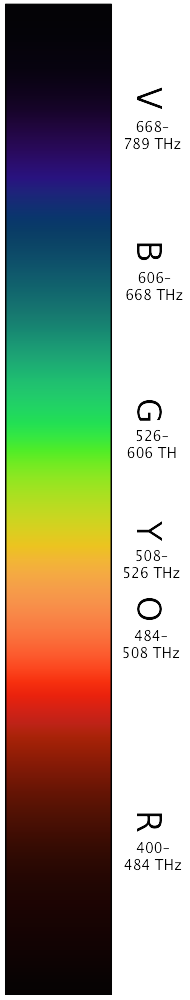
Fig. 3 A linear representation of the visible light spectrum.
A more intuitive way of representing the frequency relations among the colors is:
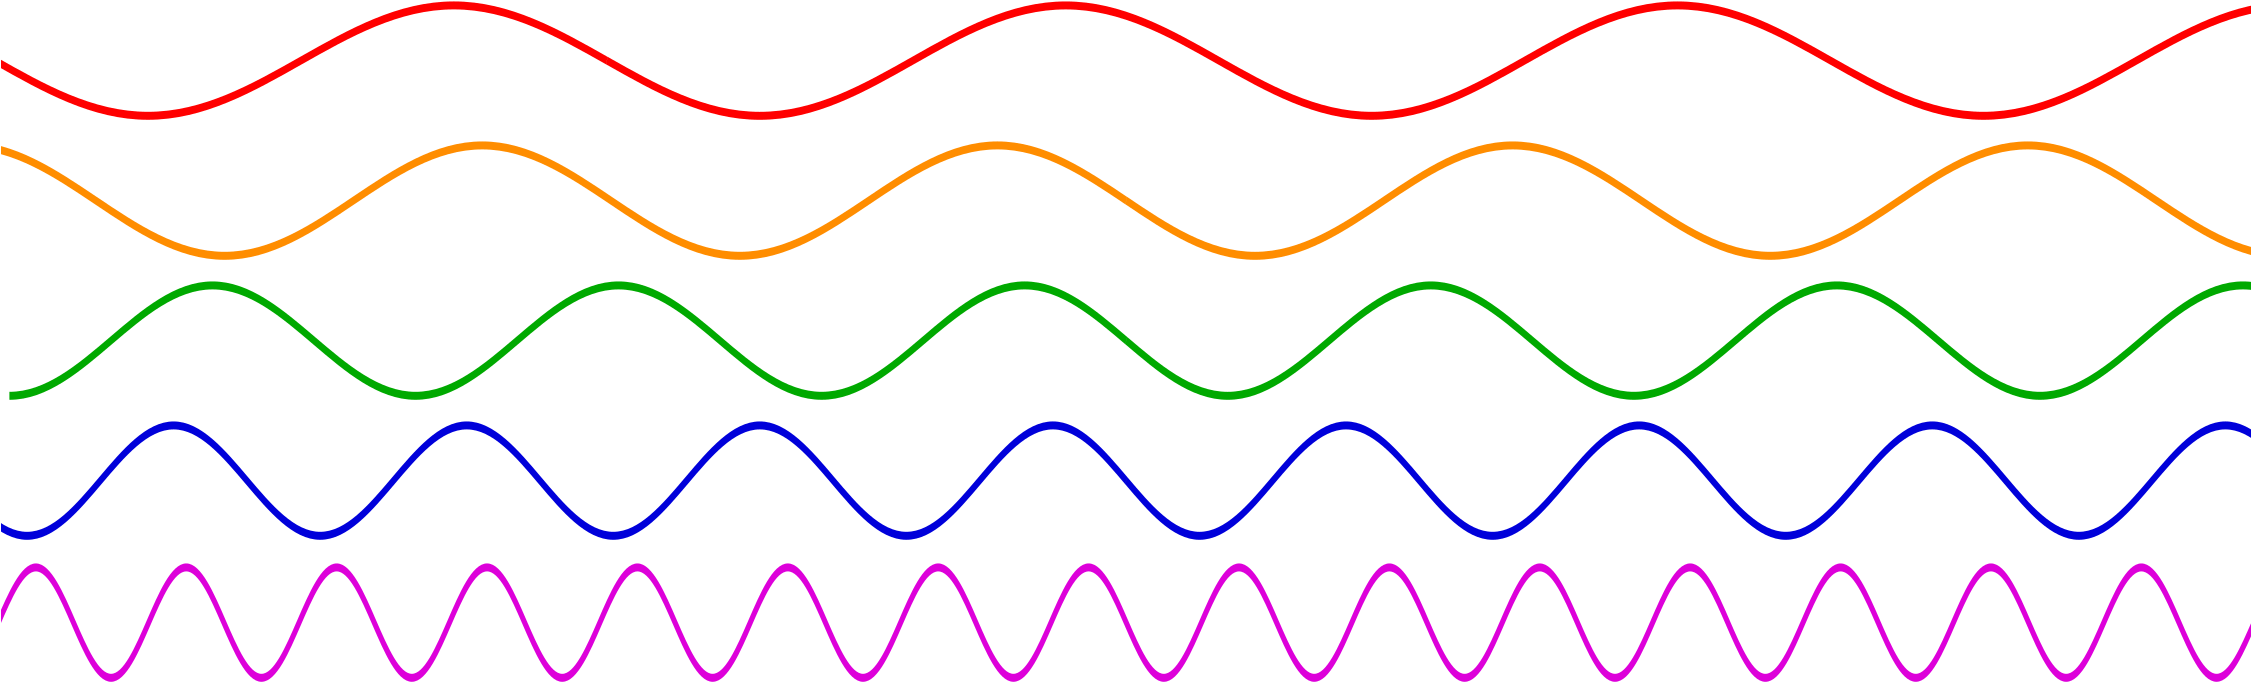
Fig. 4 Increasing frequency by light color
The important thing to remember is that red has the lowest frequency and violet the highest.
Question
Can you explain the difference between the prefixes in infra-red and ultra-violet?
Spatial frequency
Question
What is this an image of?

It’s not what you think, which you will see by clicking on this link to Gala Contemplating the Mediterranean Sea which at Twenty Meters Becomes the Portrait of Abraham Lincoln - Homage to Rothko (Second Version).
You probably thought it was a corruption or pixelization of Abraham Lincoln’s face, like the one on a five-dollar bill. Actually, it’s a painting designed to … well, you get the idea from its title.
The effect is called the “Lincoln illusion” in an article by Leon Harmon and Bela Julesz in Science and in fact graces its cover, Science 180:4091, 15 June 1973, though its psychological term is block masking. In November of the same year, Scientific American published an article by Harmon on the same topic, The recognition of faces, whose on-line version shares a pixelization of the Mona Lisa.
The painter, Salvador Dalí, was inspired by the Science article three years later to produce the work with which we began this topic.
 My discussion is based on Michael Bachs’s Face in blocks.
See the article in Frontiers of Neuroscience Marvels of illusion: illusion and perception in the art of Salvador Dali for more insight on Dalí’s art.012
There has been a tremendous amount of posterior research on this topic, but you might enjoy this short essay about an artist who has taken the techniqe in a different direction, Chuck Close and the Fragmented Image.
So what does all this have to do with frequency? Can you answer the question in the title of the following table?
Question
Grating 1 |
Grating 2 |
|---|---|

|

|
It would help to answer the question if the two images could be converted to some representation of frequency that we are already familiar with. Imagine that the amount of light reflected in each grating could be measured. The black bars would have the lowest measure (they reflect little light), while the white gaps between them would have the highest measure (they reflect the most light). There may be a fuzzy transition between the two extremes. With this convention, the gratings can be turned into waves as so:
Grating to wave 1 |
Grating to wave 2 |
|---|---|

|

|
Question
What is the frequency of each wave above?
I hope you tried to answer the question, but you can’t. Recall that we measured acoustic waves in cycles per second. Conversion of gratings to waves has plenty of cycles (extents from peak to peak), but … how would you time a static image in seconds?
The solution that researchers in psychophysics have come up with is to divide the visual field into degrees based on a standard distance from a viewer, usually six meters:
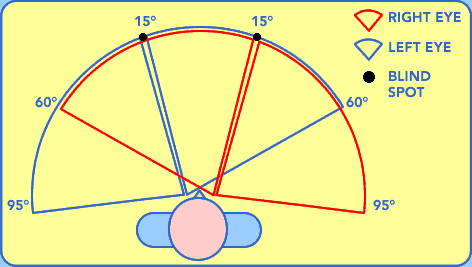
Fig. 5 The diagram above depicts the normal horizontal field of vision, including the location of the blind spots for both eyes. In a normal person, the field of vision should span a total width of 190 degrees.
Grating to wave 1 |
Grating to wave 2 |
|---|---|

|

|
The result is that each image now has a ‘denominator’, the degrees that it subtends in the visual field - let us call it 60° in the disproportionate world of Conversion of gratings to waves subtending a visual angle. Grating 1 has 7 cycles per 60°, or 8/60 = 0.12 cycles/degree. Grating 2 has 4 cycles per 60°, or 8/60 = 0.07 cycles/degree.
Question
Which one has the higher frequency?
Which leads back to what I was trying to get to with the Lincoln illusion:
Question
How is the left image transformed into the ones on its right?
Answering the following question finally leads to why I bring all of this up:
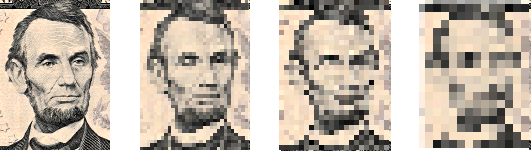
Question
Describe the two images below in your own words. Can you analyze them in terms of spatial frequency?
But you won’t get to see the answer for a while.
For more than you want to know about how spatial frequency is used to measure how well we see, see Visual Acuity by Michael Kalloniatis and Charles Luu.
Neural frequency
As you shall learn in the upcoming chapters, a neuron produces an electrical output that has a rhythmic or oscillatory nature, much like a pendulum. If enough neurons produce the same oscillation at the same time, it can be picked up by electrical or magnetic sensors outside the head. A headset of electrical sensors or electrodes is called an electroencephalograph, and the read-out of the electrodes is called an electroencephalogram. The methodology is called electroencephalography. All of these can be abbreviated as EEG:
Electroencephalograph [1] |
Electroencephalogram [2] |
|---|---|

|

|
Examine the electroencephalogram on the left more closely by clicking on it. It is a graph with an x axis of time in seconds from fifteen to twenty, though the type is so small that it is practically illegible. The y axes is the voltage output by sixteen electrodes, probably in microvolts.
Question
What happens in the middle of graph, at 17s?
You should be able to see the rhythmic ups and downs of the EEG. Electrophysiologists have been classifying these waves by their frequency for decades. The most popular classification goes something like this:

|
< 4 Hz |
Deep dreamless sleep, loss of body awareness |

|
4–7 Hz |
Deep meditation or relaxation, REM sleep |

|
7–13 Hz |
Calm relaxed yet alert state |

|
13–39 Hz |
Active, busy thinking, active processing , active concentration, arousal, and cognition |

|
> 40 Hz |
Higher mental activity, including perception, problem solving, and consciousness |
Question
Do you know the order of letters in the Greek alphabet? Hover your cursor here if you need a refresher. Do you see a correspondence between brain wave frequency and Greek letter?
Exactly what these waves do with respect to cognition in general and language in particular is a subject of considerable contemporary research and will be touched upon as we go along.
See Neural oscillation.
Respiratory rhythm
Masticatory rhythm
Imagine that you are chewing a piece of gum.
Question
What does your jaw do?
You should feel a cycle of raising and lowering of your jaw that could be described as an oscillation.
Electrophysiologists have devised a measuring technique that can make your feelings more precise. Known as electromyography (EMG), it uses an electrode on the skin to pick up the electrical potential generated by muscle cells underneath it. If you want to think of it as EEG for muscles, you won’t go wrong. To record an electromyogram of chewing, you would have to know where the muscles for opening and closing the jaw are. They are highlighted in purple in Fig. 6:
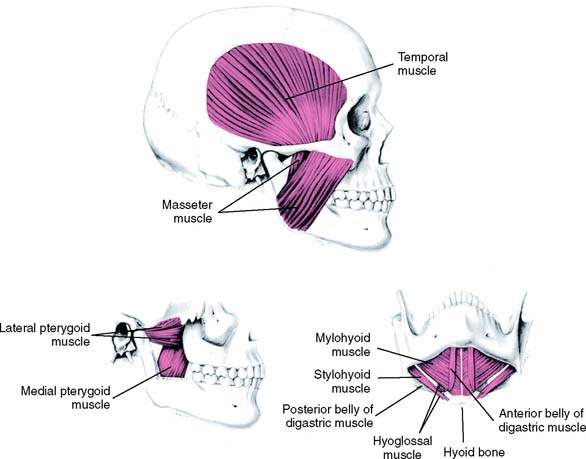
Fig. 6 Jaw muscles
The lateral pterygoid and suprahyoid (anterior belly of the digastric, geniohyoid and mylohyoid) muscles constitute the jaw opening muscles, while the temporalis, masseter and medial pterygoid muscles serve as the jaw closing muscles. An electromyogram of the masseter (Mass) and suprahyoid (SH) muscles during chewing is reproduced in Fig. 7:
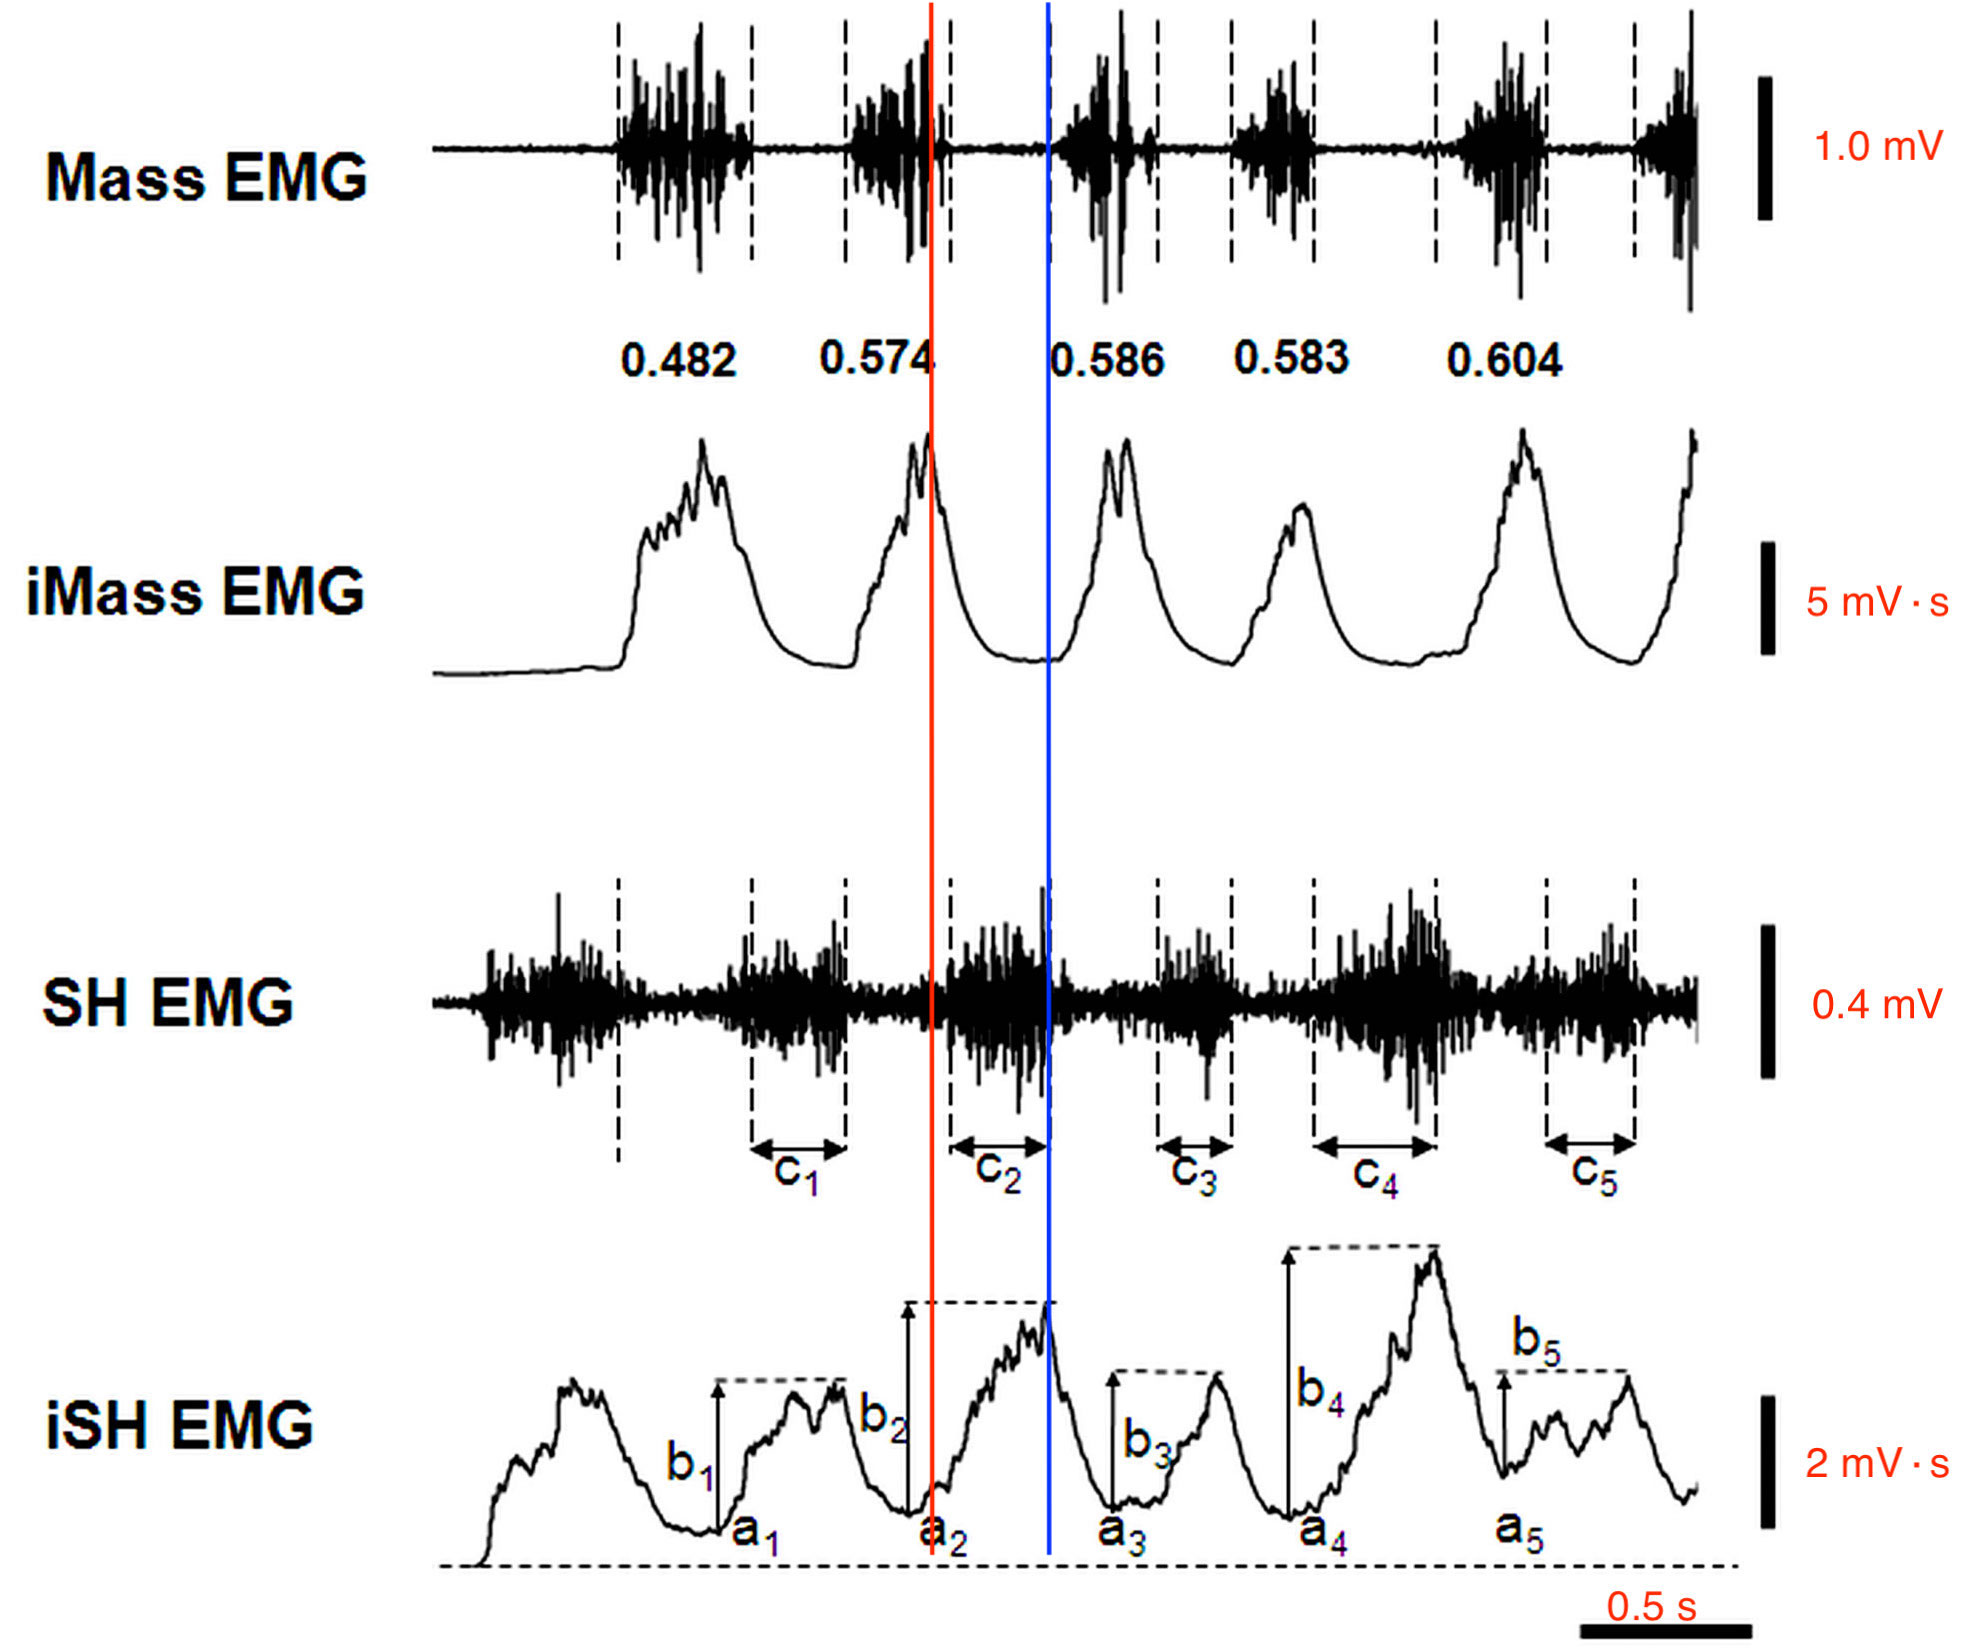
Fig. 7 Sample data of masseter and suprahyoid muscle activities during the chewing of a prune
Figure 2 from Miyaoka et al. (2014), with my addition of units and vertical lines.
The researchers only analyzed the first five cycles. The integrated EMGs of the second and fourth graphs depict the total amplitude of the raw EMGs of the first and third graphs. I added the lines to show how the maximum activity of one muscle corresponds to the minimum of the other. For instance, the red line is aligned with the peak of the iMass EMG near the trough of the iSH EMG. The blue line marks the converse configuration.
Unfortunately, the researchers were not concerned with the exact frequency of chewing, but each muscle looks like it moves at 2 Hz.
Lexical frequency
Consider this text:
Day had broken cold and grey, exceedingly cold and grey, when the man turned aside from the main Yukon trail and climbed the high earth-bank, where a dim and little-travelled trail led eastward through the fat spruce timberland. It was a steep bank, and he paused for breath at the top, excusing the act to himself by looking at his watch. It was nine o’clock. There was no sun nor hint of sun, though there was not a cloud in the sky. It was a clear day, and yet there seemed an intangible pall over the face of things, a subtle gloom that made the day dark, and that was due to the absence of sun. This fact did not worry the man. He was used to the lack of sun. It had been days since he had seen the sun, and he knew that a few more days must pass before that cheerful orb, due south, would just peep above the skyline and dip immediately from view.
To Build a Fire by Jack London
Question
What do you think is the most frequent word in it? What is the least frequent one?
The obvious way to answer the questions is to count the number of occurrences of every word in the text. This is tedious, though, and I would rather have a computer do it.
Ok, I just had made my computer tally the words in he text. There are 109 unique words, but I am only going to display the results of the first thirty most frequent:
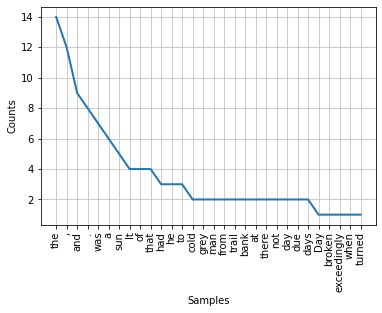
Fig. 8 A plot of the first thirty most frequent words in the text above
Author’s plot from Natural Language Toolkit code.
Question
What’s the most frequent word in this text? And is the least frequent one?
the is the most frequent and Day, broken, exceedingly, when and turned tie for the least frequent, with a count of one. Actually, there are about seventy-nine more words that were counted but a single time.
Warning
Are they all words?
No. A peculiarity of the program that I used is that it counts punctuation as words. I could have left . and , out, but they help to make a smoother transition between the most frequent and least frequent ‘words’.
Acoustic frequency
Imagine that you pluck the string on a guitar. It will vibrate back and forth somewhat like the curve in the top part of Fig. 9:
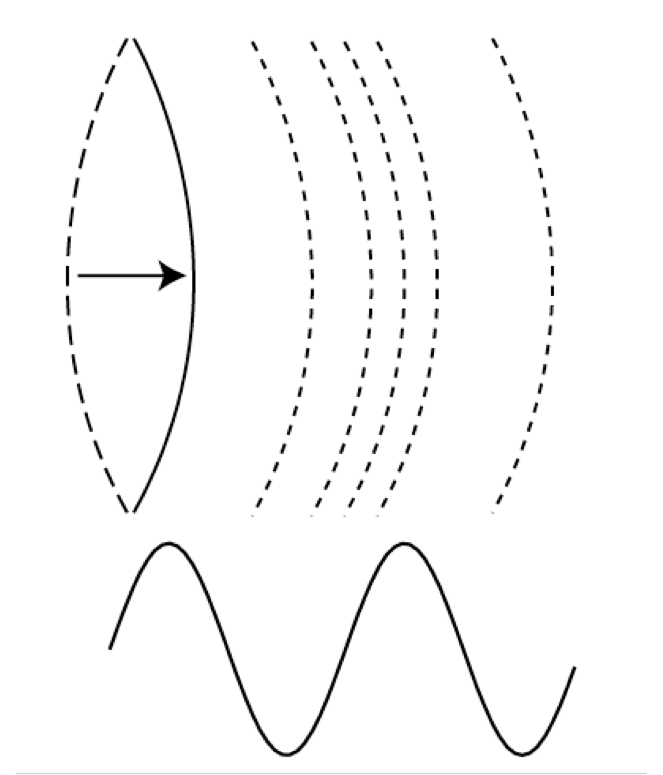
Fig. 9 Vibrating string and the waveform it produces
Author’s image.
This oscillation is conventionally represented as in the bottom half of the figure, in which the displacement of the string from side to side is measured as the displacement of the wave from bottom to top, and time flows from left to right. Since the displacement repeats itself, it is said to oscillate. A single cycle of the oscillation is measured from one peak to the next of the waveform. The number of cycles that occur during some unit of time constitutes the frequency of the oscillation. The basic unit of frequency, the hertz (Hz), is defined as cycles per second.
This is simple enough, and if this were all there was, then the world would be an acoustically rather dull place.
It turns out that not only can a guitar string vibrate at the frequency of the entire string, but segments of a string can vibrate independently. The figure Vibrating segments of a string depicts how this is possible. Each half of the string completes a cycle in half the time of the whole string:
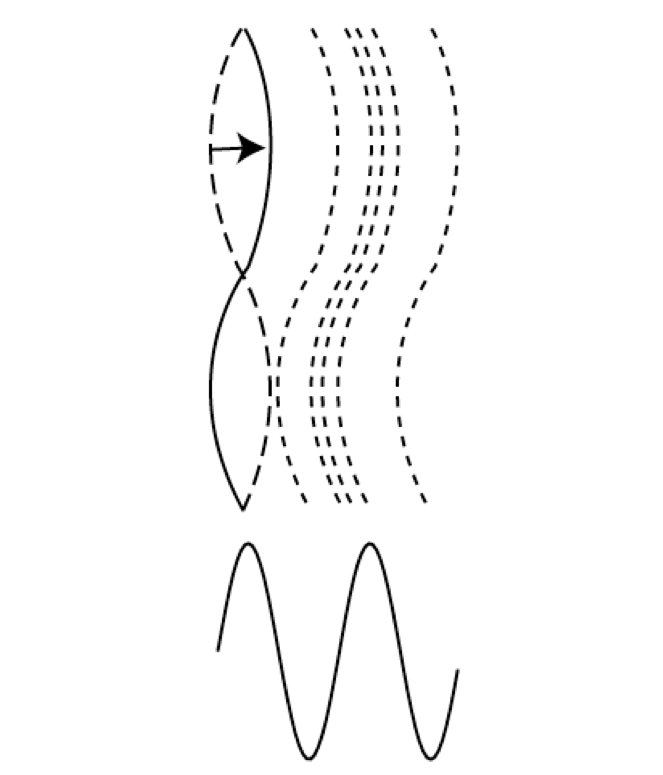
Fig. 10 Vibrating segments of a string
Author’s image.
The result is that the halves have twice the frequency of the whole.
This can go on and on:
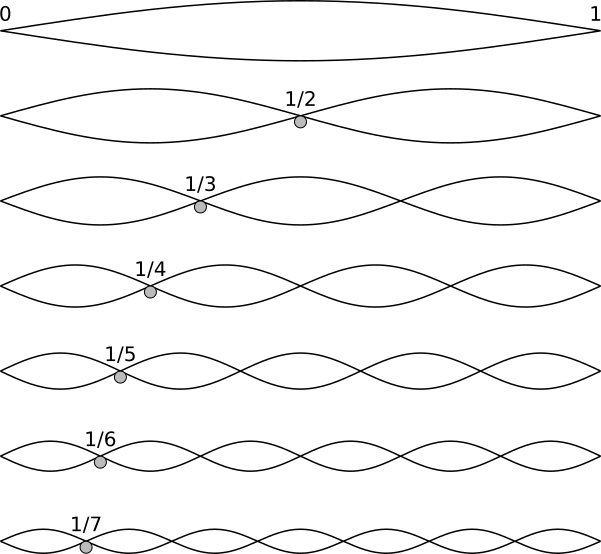
Fig. 11 Vibration and standing waves in a string
The vibration of the whole string is so fundamental, that it has its own name, the fundamental frequency, and its own abbreviation as \(F_0\). The higher frequencies that are multiples of the fundamental (fractions of the string) are usually known as harmonics and are indicated with subscript integers, e.g. \(F_1, F_2\), etc.
Nature makes this deliciously complex by allowing the string to vibrate at all these frequencies at the same time. Fig. 12 displays the outcome of superimposing both frequencies on the string and the waveform, a phenomenon known as superposition:
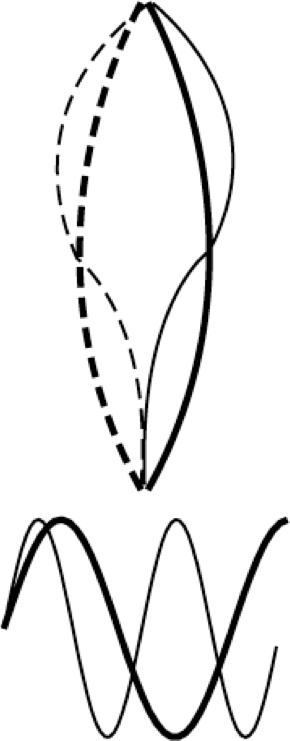
Fig. 12 Superposition of whole and half oscillations of a string
Author’s image.
I put together a sound file with a snippet of wind blowing, a meadowlark singing, a bell ringing and me saying “To be or not to be, that is the question”. I open it in Praat to the screen in Fig. 13:
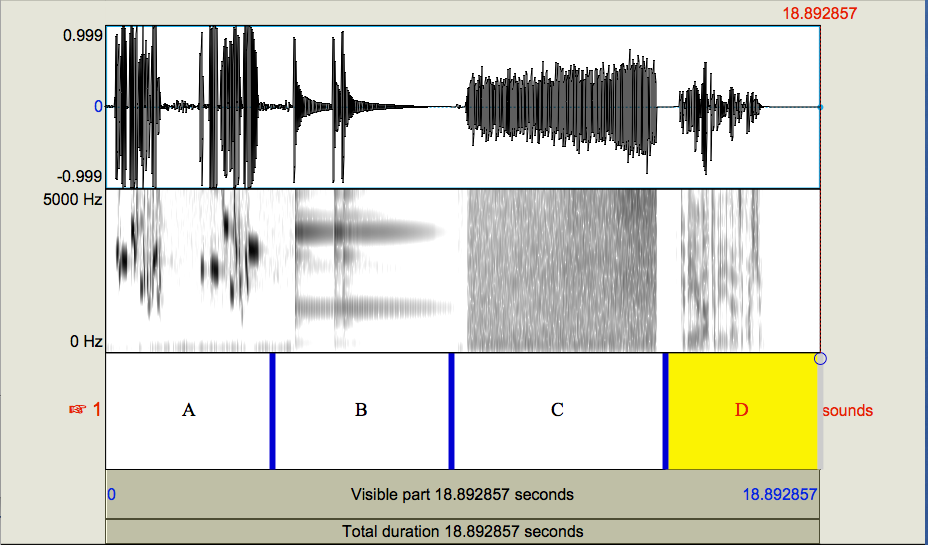
Fig. 13 Four sounds
Screenshot from Praat [4]
Questions
Which of the four graphs A through D corresponds to which sound?
Whenever you are confronted with a graph, the first thing to do is to look at the labels on its axes. The graphs above have two of them, a horizontal one which is usually called “x” and a vertical one which is usually called “y”.
Questions
What is the x axis? What is its range?
What are the two y axes? What is the range of the first? What about the second?
The x axis measures time in seconds. The file is nearly nineteen seconds long.
The y axis has two sub-axes. The top one is extremely unhelpful, since its three measurements, 0.999, 0, and -0.999 are not labeled with any unit. They are measures of a sound’s amplitude. In theory, this should be pressure, whose unit is the pascal, though I have not found any mention of it in the Praat documentation. Praat normalizes this amplitude tracing to its highest and lowest measures – here nearly 1 and -1. These extremes indicate the levels at which the equipment used to record the sound and the equipment used to play it back reach their limits of fidelity, beyond which the sound will be distorted. It has a certain amount of structure that may help you to identify the sounds, but it is probably not informative enough.
The other one is labelled in Hertz, from 0 to 5000, and so measures frequency. As you can see, frequency contains a lot detailed information.
By the way, a graph with two axes is often called two dimensional, under the assumption that each axis measures a different dimension.
Summary
In this chapter, you have learned about the notion of frequency from eight domains:
pendulum
sine wave
light waves
visual space
brain waves
chewing
words in a text
sound
References
Harmon, Leon D., and Bela Julesz. “Masking in Visual Recognition: Effects of Two-Dimensional Filtered Noise.” Science 180.4091 (1973): 1194.
Harmon, Leon D. “The recognition of faces”. Scientific American 229(5):71–82.
Martinez-Conde, Susana, Dave Conley et al. “Marvels of Illusion: Illusion and Perception in the Art of Salvador Dali.” Frontiers in Human Neuroscience 9 (2015): 496.
Miyaoka, I. Ashida, H. Iwamori, S. Kawakami, T. Yamazaki and N. Ito, “The Effect of Masseter Activity Patterns during Chewing on Suprahyoid Activity in Subsequent Chewing Cycles,” Journal of Behavioral and Brain Science, Vol. 4 No. 2, 2014, pp. 69-74. doi: 10.4236/jbbs.2014.42009.
Endnotes
The next topic
Come to class having read Speech and answered the questions.
Last edited Aug 18, 2025